Open Access
Fig. 1.
Download original image
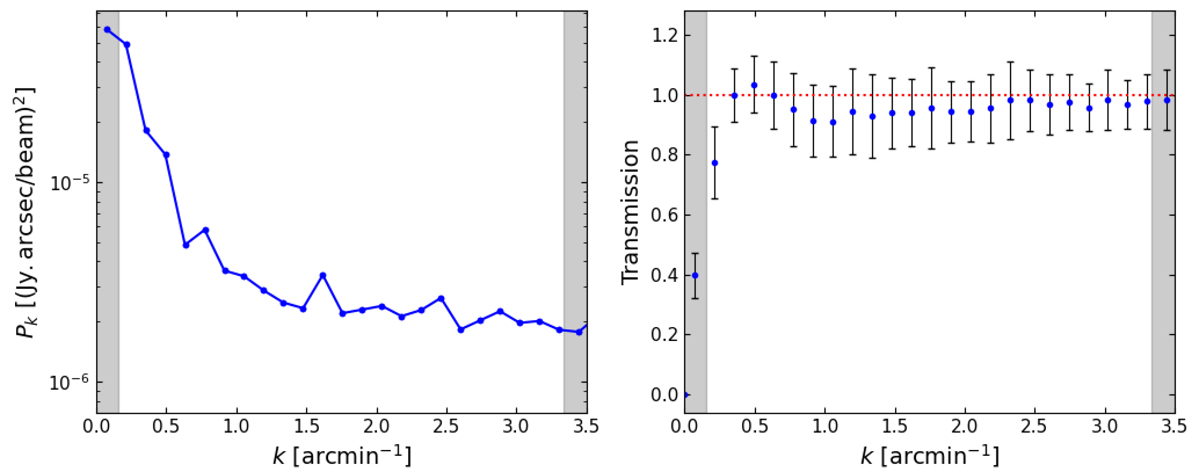
Left: Power spectrum of the residual noise at 150 GHz, estimated for ACTJ0240 using the half-difference maps. Right: 150 GHz pipeline transfer function for ACTJ0240. The shaded region on the left (right) in both plots depicts the NIKA2 field of view (instrumental full width at half maximum (FWHM) ).
Current usage metrics show cumulative count of Article Views (full-text article views including HTML views, PDF and ePub downloads, according to the available data) and Abstracts Views on Vision4Press platform.
Data correspond to usage on the plateform after 2015. The current usage metrics is available 48-96 hours after online publication and is updated daily on week days.
Initial download of the metrics may take a while.