Open Access
Fig. 5
Download original image
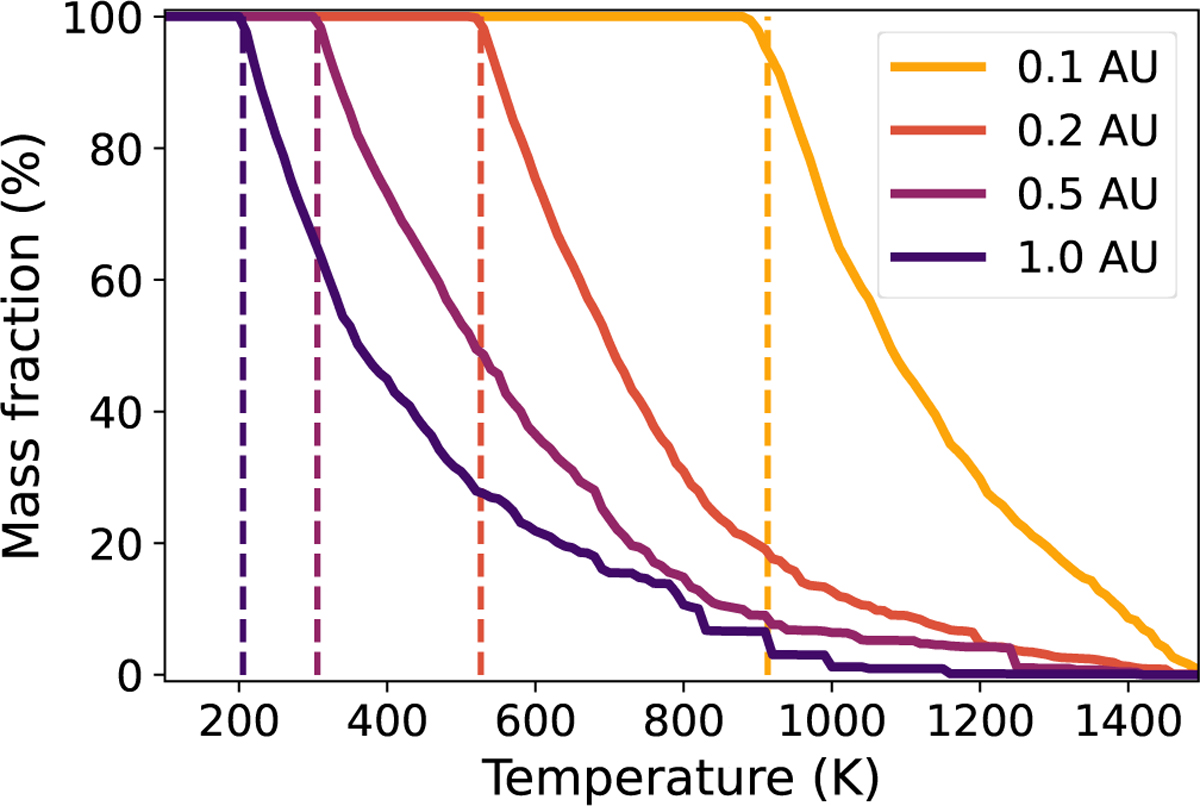
Fraction of the dust mass in the disk midplane at r = 0.1, 0.2, 0.5, and 1 AU that has been subjected to at least the given temperature due to dynamical transport toward warmer regions. The dashed lines indicate the dust temperature at the position of the local dust population.
Current usage metrics show cumulative count of Article Views (full-text article views including HTML views, PDF and ePub downloads, according to the available data) and Abstracts Views on Vision4Press platform.
Data correspond to usage on the plateform after 2015. The current usage metrics is available 48-96 hours after online publication and is updated daily on week days.
Initial download of the metrics may take a while.