Open Access
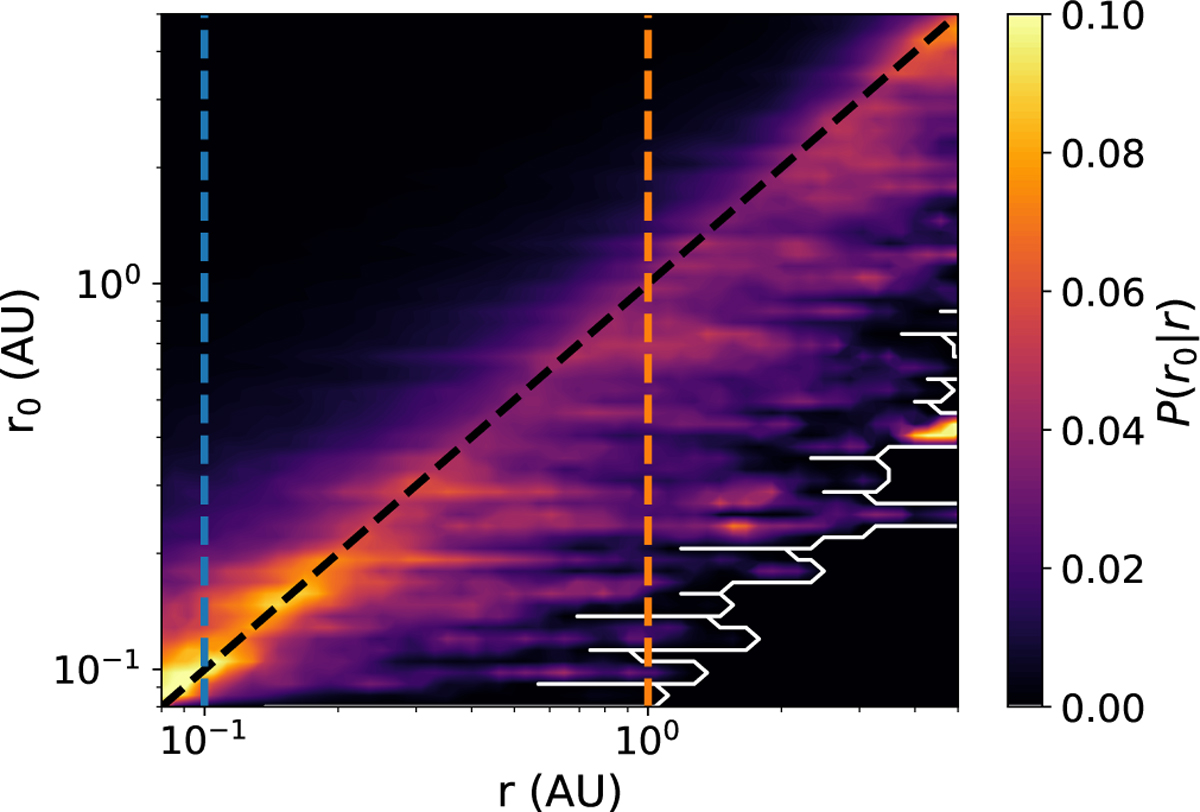
Fig. 1
Download original image
Overview of the distribution, P(r0|r), of the monomer positions of origin r0 as a function of radial position r. The 1:1 axis is shown with black dashes, while the colored dashed lines indicate the radial locations r = 0.1, 1 AU of the slices shown in Fig. 2.
Current usage metrics show cumulative count of Article Views (full-text article views including HTML views, PDF and ePub downloads, according to the available data) and Abstracts Views on Vision4Press platform.
Data correspond to usage on the plateform after 2015. The current usage metrics is available 48-96 hours after online publication and is updated daily on week days.
Initial download of the metrics may take a while.