Fig. C.1.
Download original image
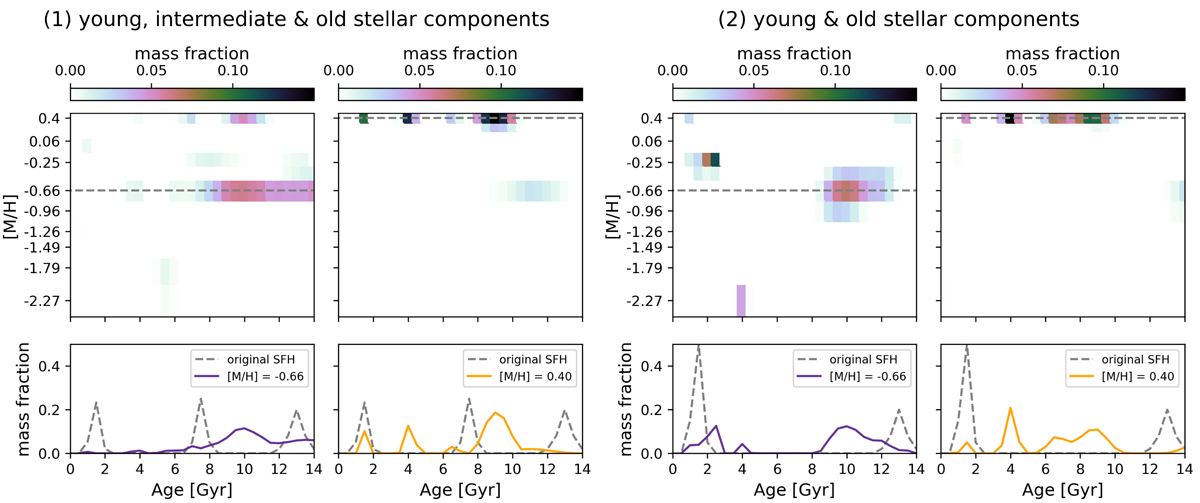
Star formation histories for two example mock distributions from the tests described in Sect. C.1. On the left, we show the results of mock spectra obtained by combining SSP models of young, intermediate, and old ages, while the right panels show results of mock spectra obtained by combining only young and old ages. For each of the two initial age distributions, a two-dimensional grid of metallicity and age is shown in the top panels for the tested metallicities [M/H] = -0.66 and 0.40 dex from left to right, which is indicated with a dashed gray line. In these grid plots, the mass fraction that PPXF gives to each SSP template is color-coded. The bottom panels show the star formation history distribution that is recovered from these top grids (solid lines) in terms of mass fraction per age, together with the initial star formation history (SFH) age distribution from which the mock spectra were created (dashed gray line).
Current usage metrics show cumulative count of Article Views (full-text article views including HTML views, PDF and ePub downloads, according to the available data) and Abstracts Views on Vision4Press platform.
Data correspond to usage on the plateform after 2015. The current usage metrics is available 48-96 hours after online publication and is updated daily on week days.
Initial download of the metrics may take a while.