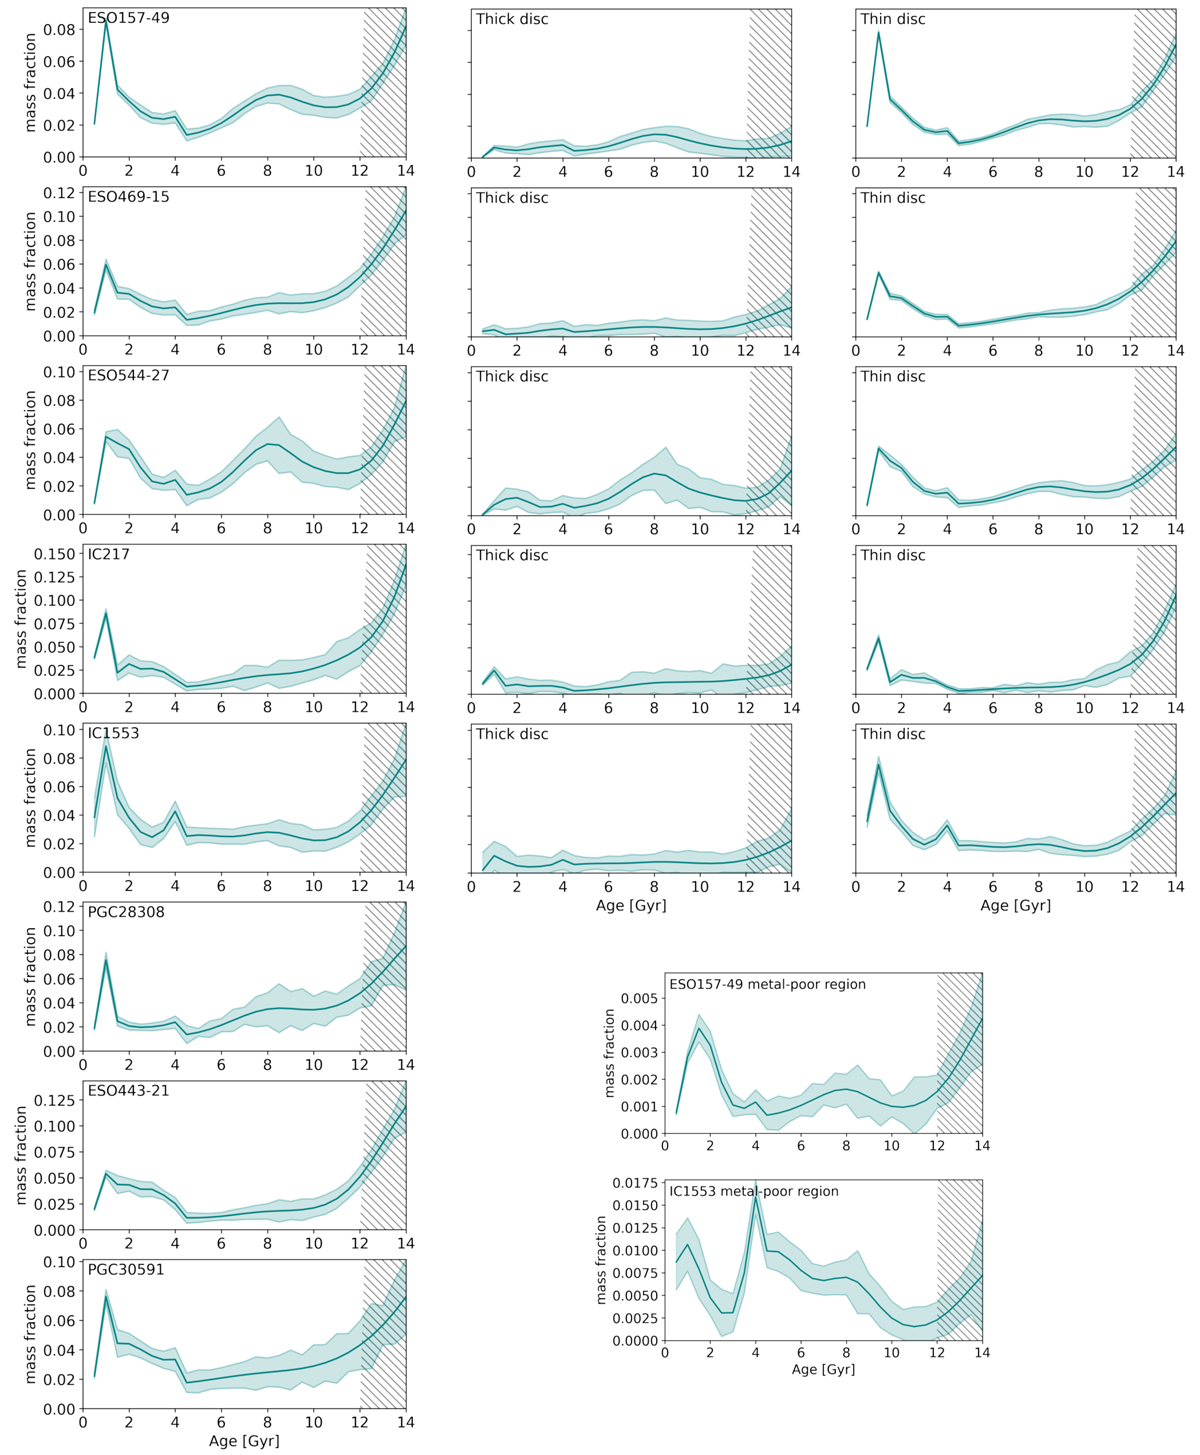
Fig. 4.
Download original image
Star formation histories in terms of mass fraction per age with evenly spaced age bins every 0.5 Gyr. The uncertainties from the Monte Carlo simulations are shown by the shaded light blue areas. The left column shows the star formation histories for the fully covered regions of the galaxies, while the middle and right columns show the thick and thin disks, respectively, for the five out of the eight galaxies containing two well-defined disk components (they share the same y-axis with the left column). The additional separate panels on the lower right corner show the star formation histories of the metal-poor regions for ESO 157-49 and IC 1553. Large mass fractions at old ages should be handled with caution, as there might be a bias of PPXF fitting toward very old ages (see Sect. 5.2) and are shaded with a gray area.
Current usage metrics show cumulative count of Article Views (full-text article views including HTML views, PDF and ePub downloads, according to the available data) and Abstracts Views on Vision4Press platform.
Data correspond to usage on the plateform after 2015. The current usage metrics is available 48-96 hours after online publication and is updated daily on week days.
Initial download of the metrics may take a while.