Open Access
Fig. 9.
Download original image
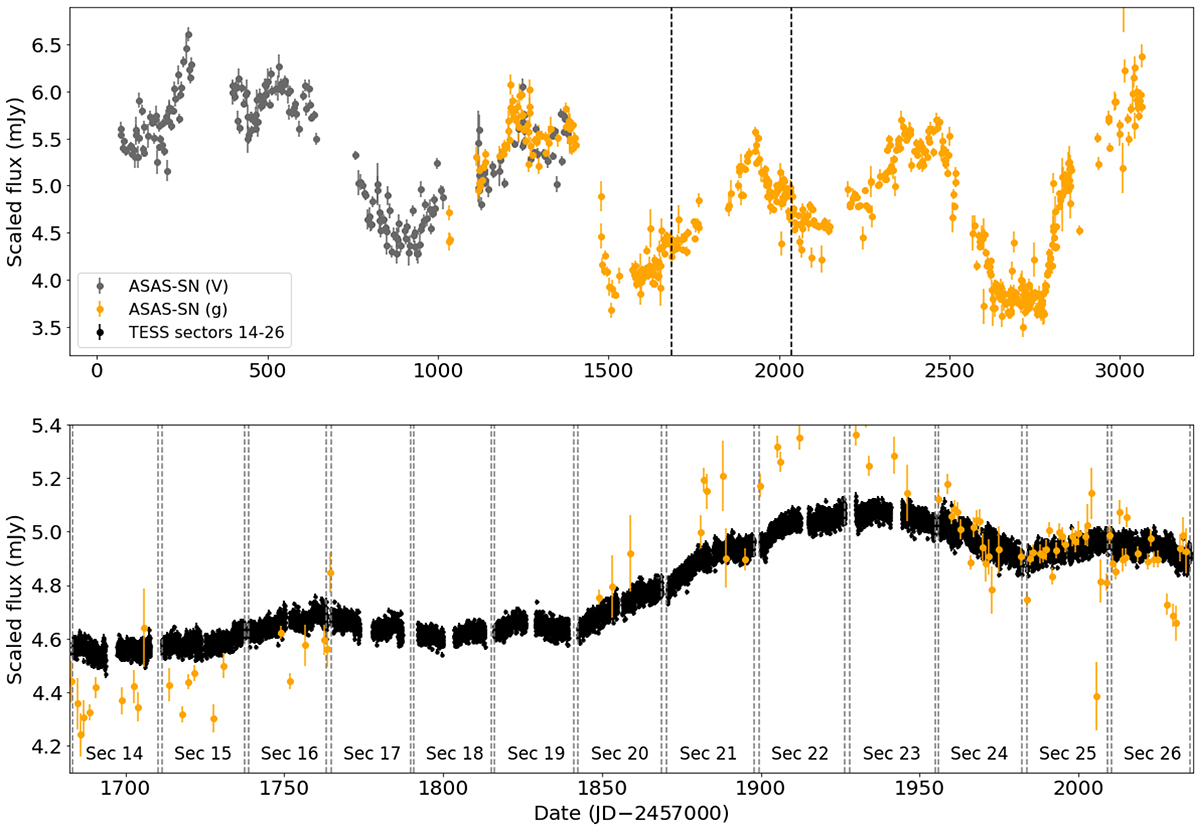
Top: ASAS-SN light curve of PG 1613+658 with the observation window of PG 1613+658 during the TESS primary mission marked. Bottom: TESS primary mission light curve of PG 1613+658 along with the ASAS-SN g-band data. The vertical dashed lines are the sector boundaries.
Current usage metrics show cumulative count of Article Views (full-text article views including HTML views, PDF and ePub downloads, according to the available data) and Abstracts Views on Vision4Press platform.
Data correspond to usage on the plateform after 2015. The current usage metrics is available 48-96 hours after online publication and is updated daily on week days.
Initial download of the metrics may take a while.