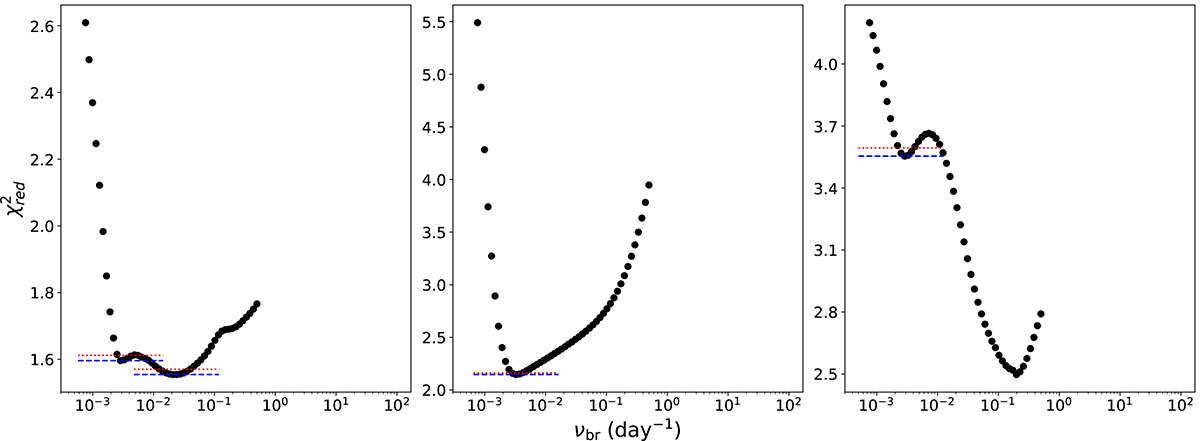
Fig. 8.
Download original image
Reduced chi-squared as a function of break frequency for the three fits shown in Figure 7. There are two minima for the DRW fit to the ASAS-SN PSDs, but the minimum at the higher frequency is in the noise-dominated region, so the low-frequency break is used. The dashed blue lines indicate the local minima and the dotted red lines indicate the 1-sigma confidence level.
Current usage metrics show cumulative count of Article Views (full-text article views including HTML views, PDF and ePub downloads, according to the available data) and Abstracts Views on Vision4Press platform.
Data correspond to usage on the plateform after 2015. The current usage metrics is available 48-96 hours after online publication and is updated daily on week days.
Initial download of the metrics may take a while.