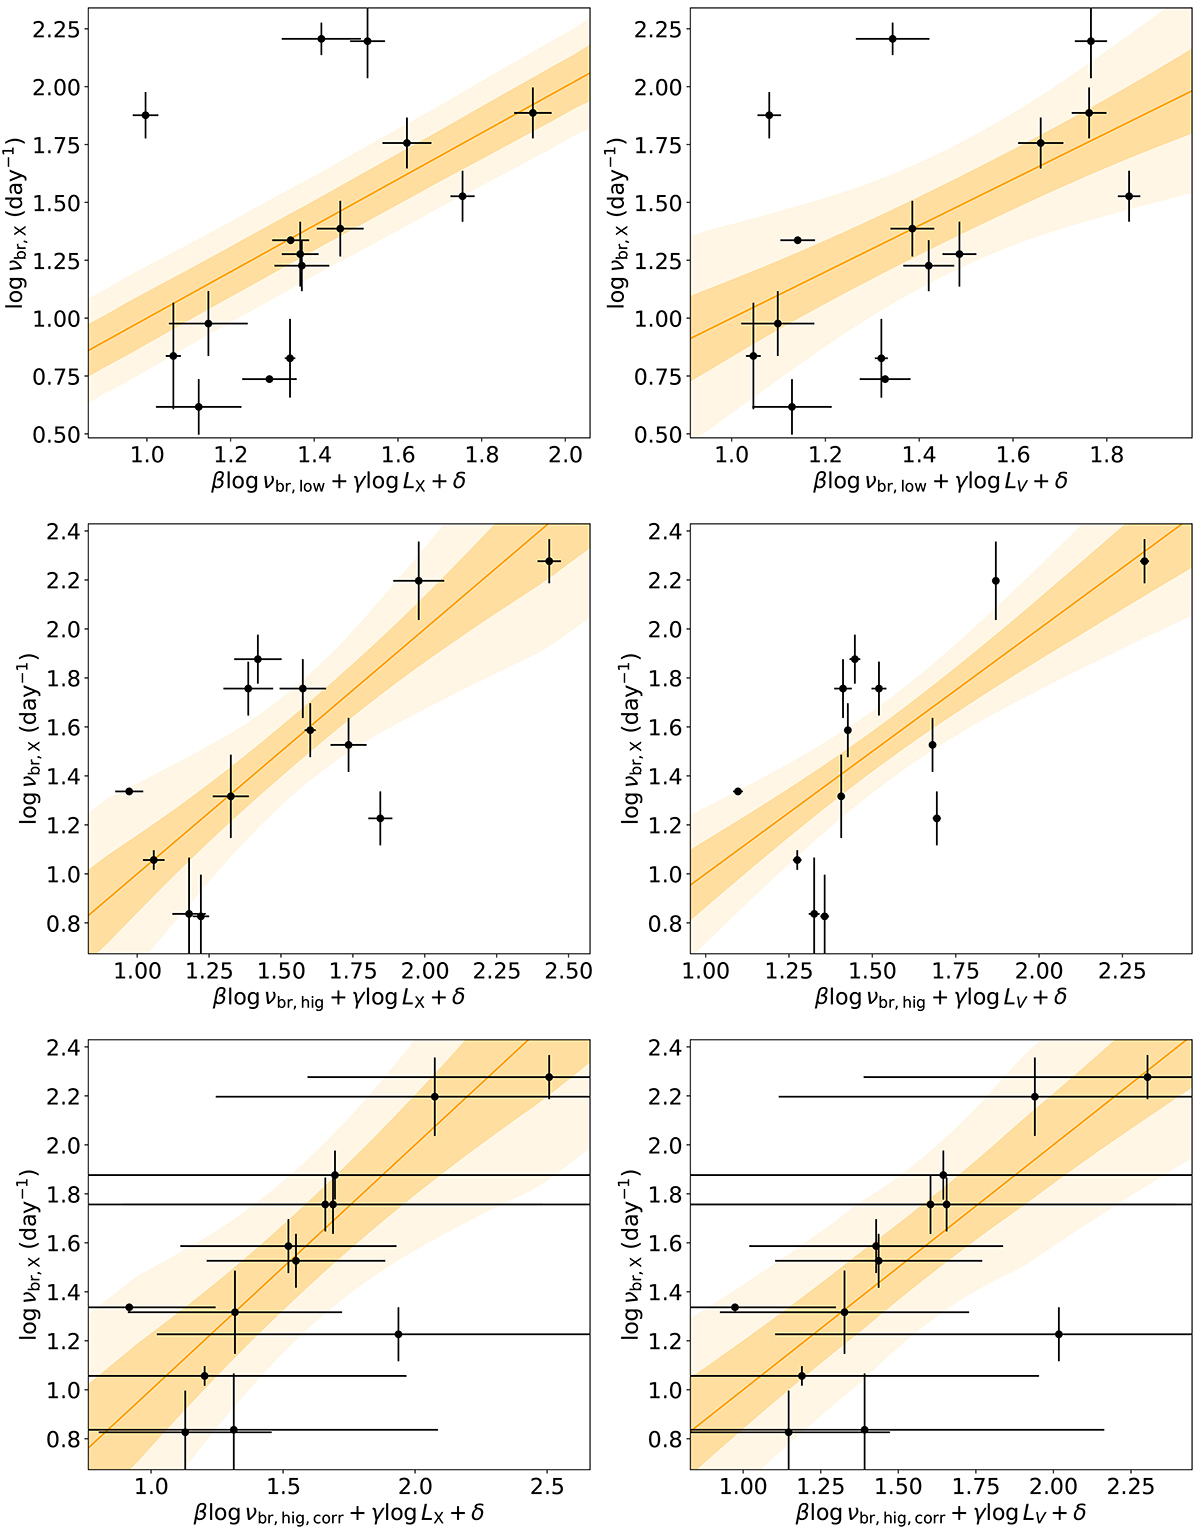
Fig. B.1.
Download original image
Multi-variable correlation between X-ray break frequency and different optical break frequencies–log νbr, low (top), log νbr, hig (middle), and log νbr, hig, corr (bottom)–with the addition of X-ray luminosity (left) or V-band luminosity (right). The dark and lightly shaded regions represent the 68% and 95% confidence ranges, respectively.
Current usage metrics show cumulative count of Article Views (full-text article views including HTML views, PDF and ePub downloads, according to the available data) and Abstracts Views on Vision4Press platform.
Data correspond to usage on the plateform after 2015. The current usage metrics is available 48-96 hours after online publication and is updated daily on week days.
Initial download of the metrics may take a while.