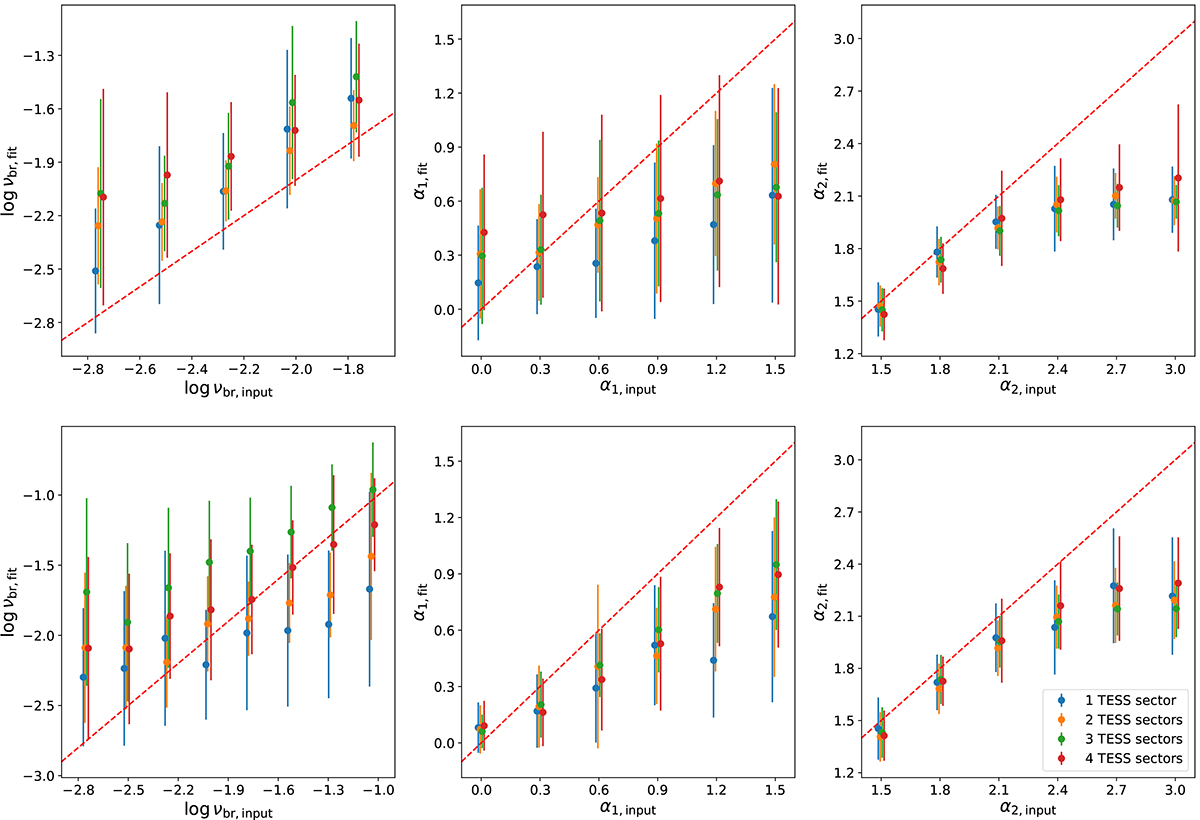
Fig. 16.
Download original image
Comparisons of BPL model parameters from the PSD fitting method and the true values used for light curve simulations. Variations from the low-frequency and high-frequency break parameters are shown on top and bottom panels, respectively. The dashed red line in each panel represents the one-to-one relation. The data points are slightly offset along the x-axis to make them distinguishable.
Current usage metrics show cumulative count of Article Views (full-text article views including HTML views, PDF and ePub downloads, according to the available data) and Abstracts Views on Vision4Press platform.
Data correspond to usage on the plateform after 2015. The current usage metrics is available 48-96 hours after online publication and is updated daily on week days.
Initial download of the metrics may take a while.