Fig. 10.
Download original image
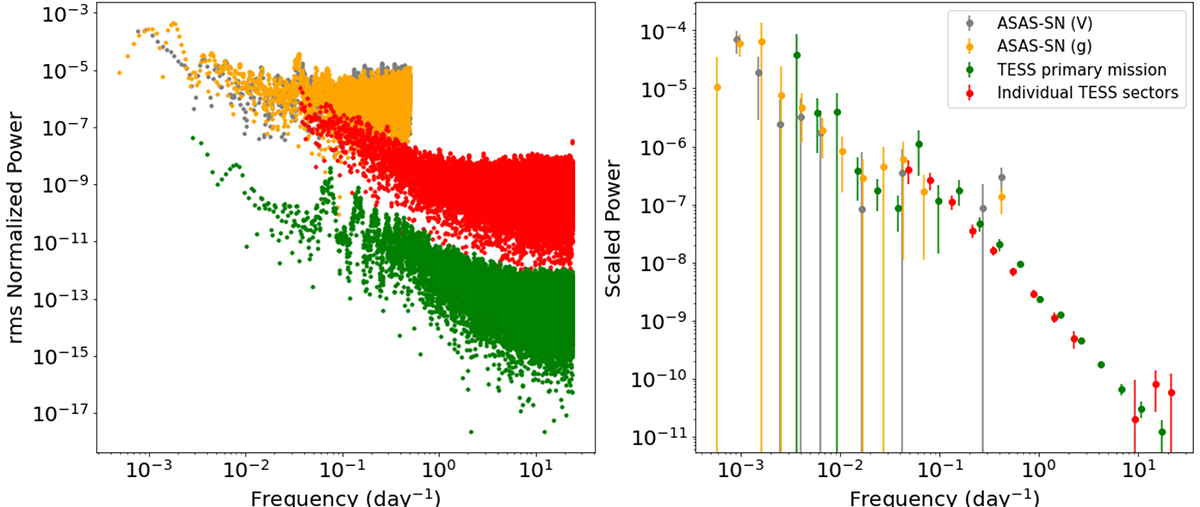
Left: rms-normalised PSDs of PG 1613+658. The PSD in green was constructed using the continuous 13 sector TESS light curve, while the red is the collection of the individual sector PSDs. Right: Binned PSDs with the white noise level subtracted and scaled to line up. The individual TESS sector PSDs were averaged before being binned.
Current usage metrics show cumulative count of Article Views (full-text article views including HTML views, PDF and ePub downloads, according to the available data) and Abstracts Views on Vision4Press platform.
Data correspond to usage on the plateform after 2015. The current usage metrics is available 48-96 hours after online publication and is updated daily on week days.
Initial download of the metrics may take a while.