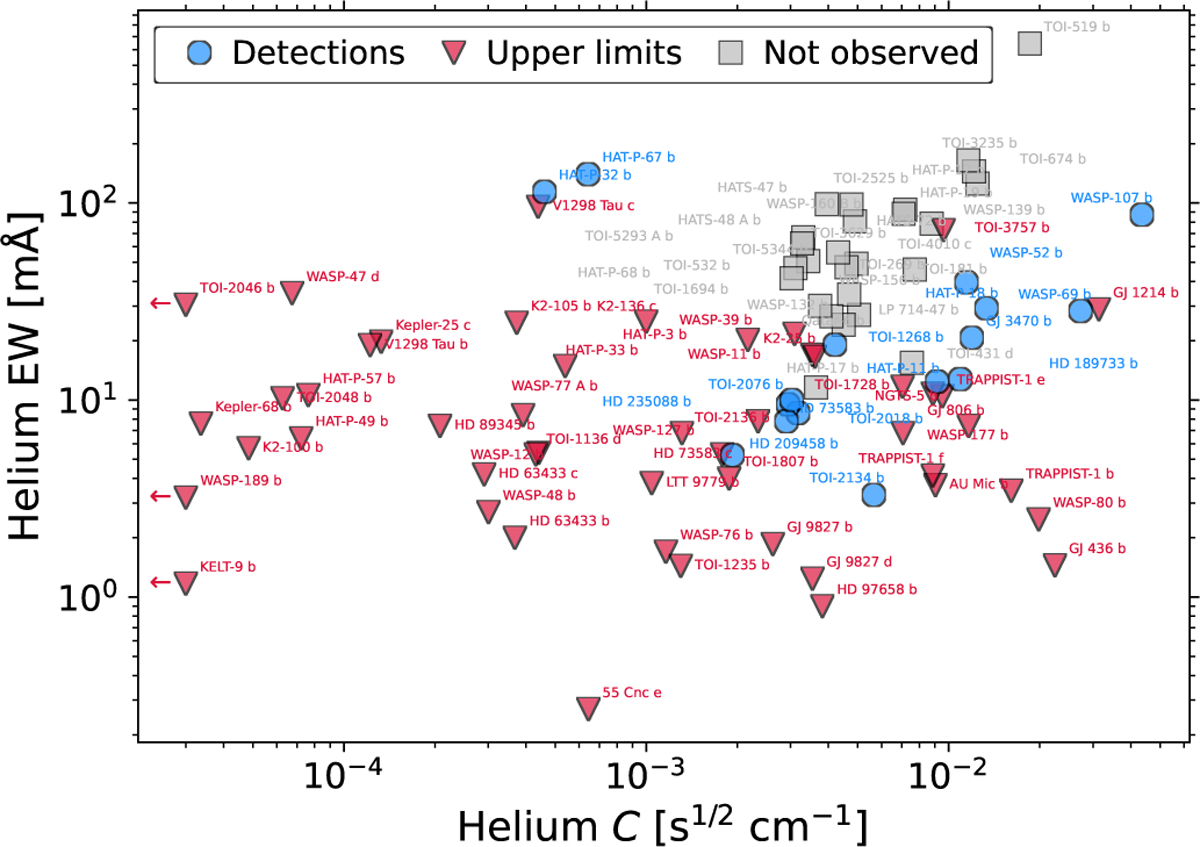
Fig. 7
Download original image
Comparison between the EWs of the metastable helium line and the helium C (a proxy for the expected helium S/N based on the model EW and the J-magnitude; Eq. (B.9)). We include the observed helium planet sample as compiled in Orell-Miquel et al. (2024), as well as potentially good targets that have not yet been observed and have helium C > 3 × 10⁻³ s−1/2 cm−1. For the observed planets, we plot observed EW values, while we plot model EW values for the planets that have not been targeted yet. They are also listed in Table B.1.
Current usage metrics show cumulative count of Article Views (full-text article views including HTML views, PDF and ePub downloads, according to the available data) and Abstracts Views on Vision4Press platform.
Data correspond to usage on the plateform after 2015. The current usage metrics is available 48-96 hours after online publication and is updated daily on week days.
Initial download of the metrics may take a while.