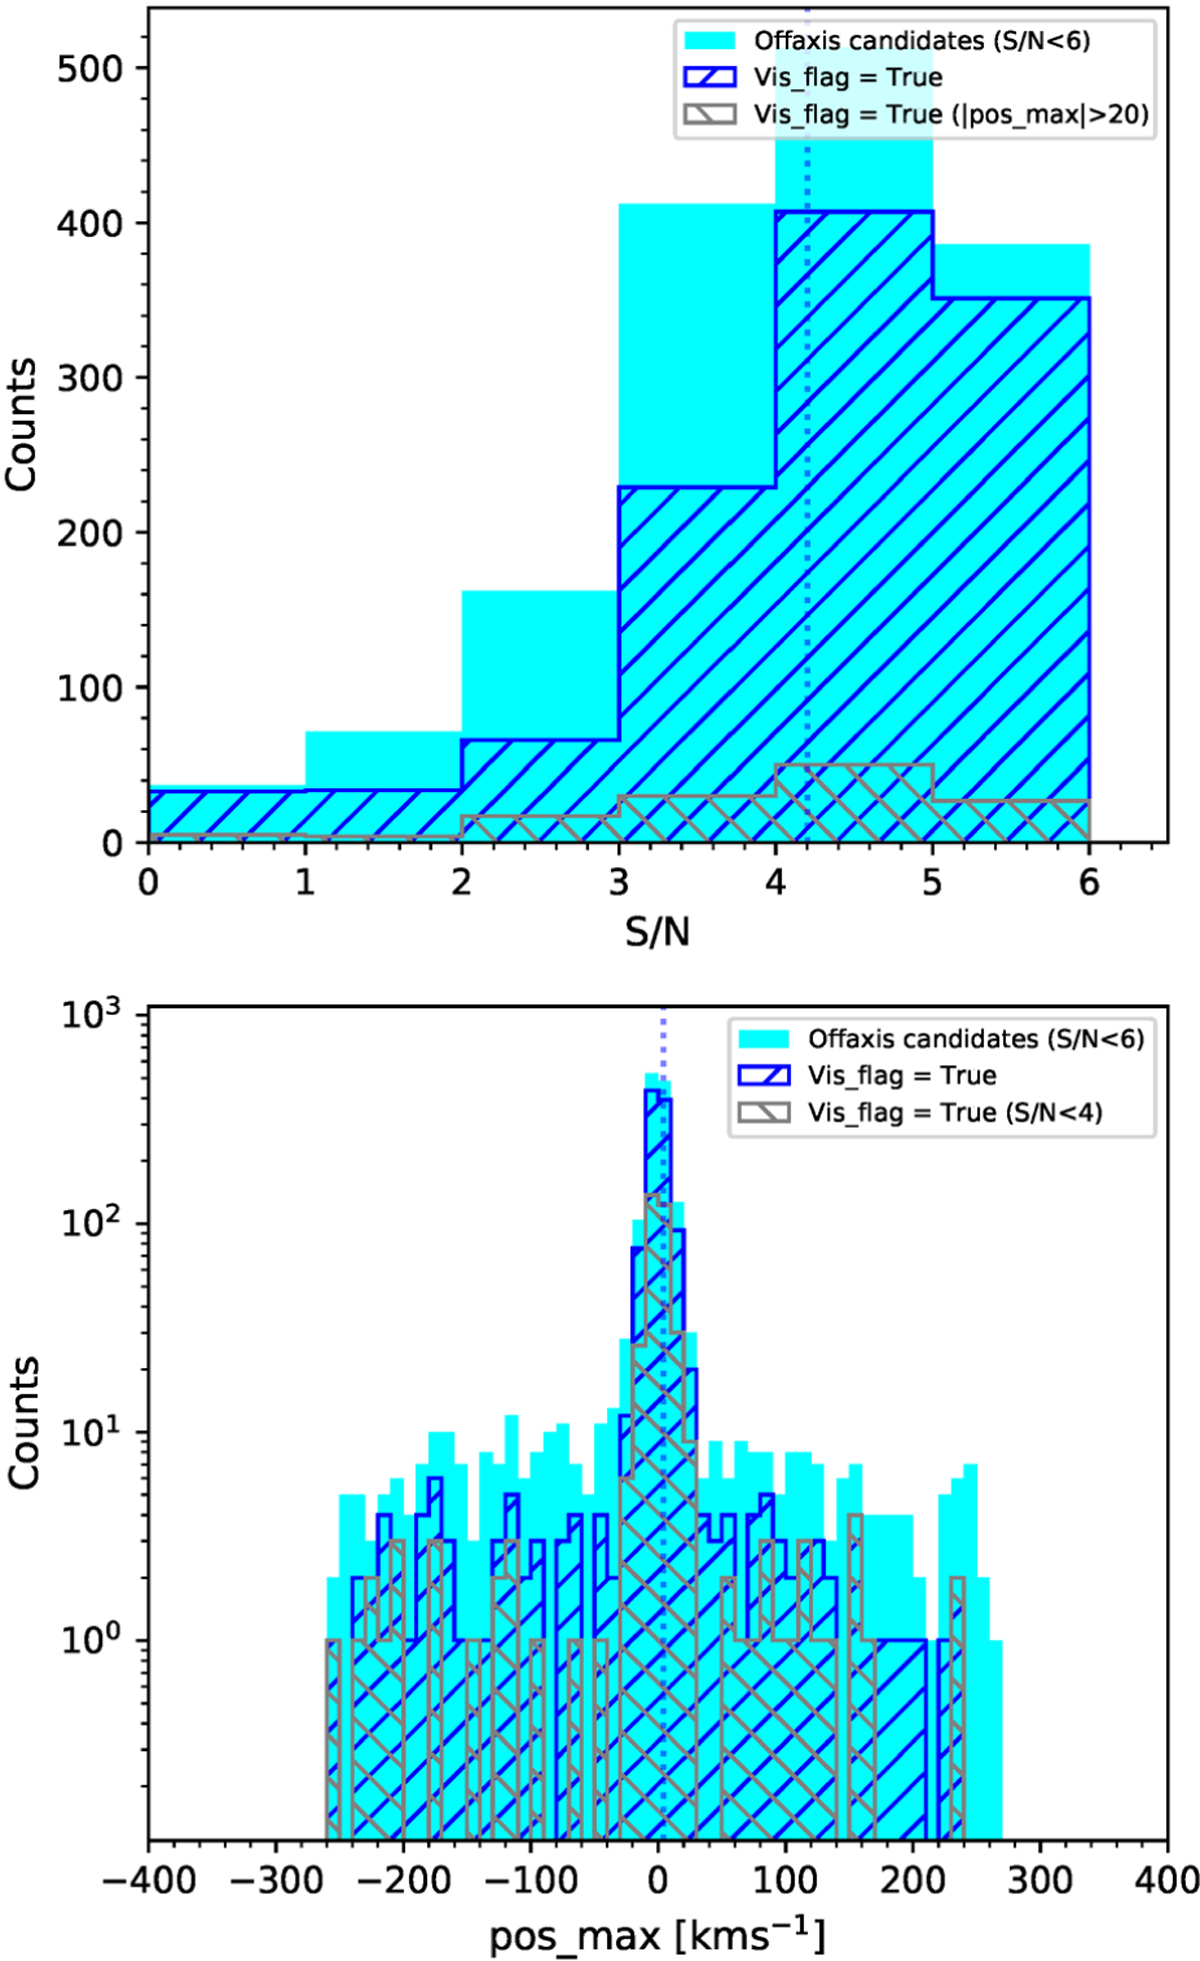
Fig. 8
Download original image
Distribution of peak S/N (top) and position (bottom) for off-axis candidates with S/N<6, with vertical dotted lines representing the median values. The subset of candidates with Vis_flag = True are shown as hatched histograms. The histograms in “\” demonstrate that high-velocity (|pos_max| > 20 km s−1) detections are not necessarily at low-S/N (see text for details).
Current usage metrics show cumulative count of Article Views (full-text article views including HTML views, PDF and ePub downloads, according to the available data) and Abstracts Views on Vision4Press platform.
Data correspond to usage on the plateform after 2015. The current usage metrics is available 48-96 hours after online publication and is updated daily on week days.
Initial download of the metrics may take a while.