Fig. 7
Download original image
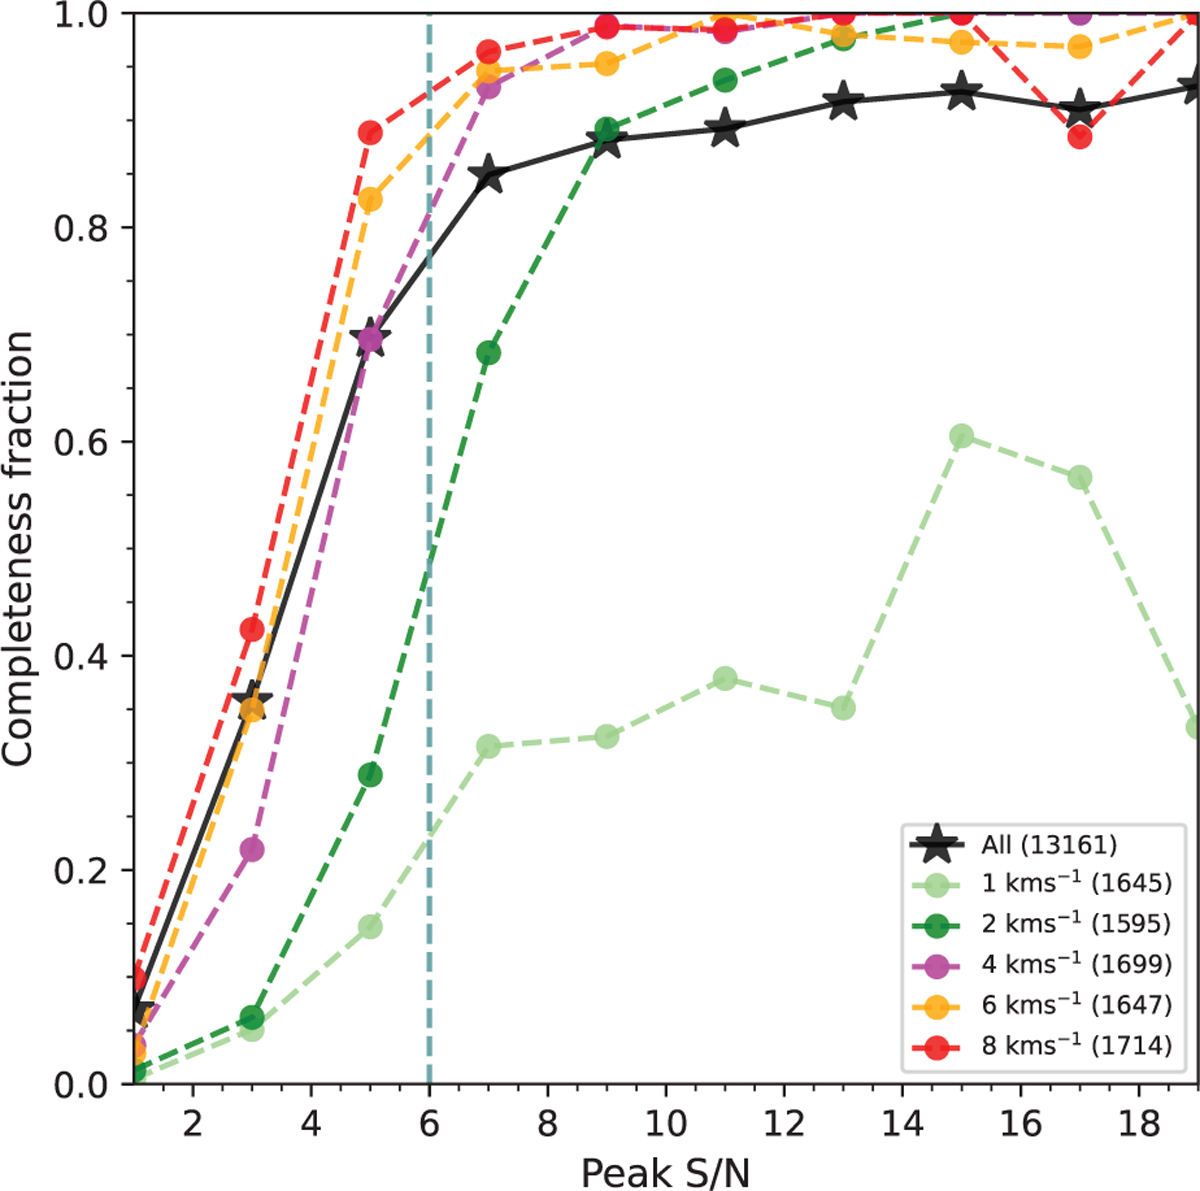
Completeness fraction (Eq. (3)) as a function of peak S/N of injected absorbers. The number of injected absorbers are given in the legend specifying line width (σ). For clarity, the measurements for σ > 8 km s−1, comprising <10% of the MALS sample have been omitted. The vertical dashed line corresponds to peak S/N cutoff of 6.
Current usage metrics show cumulative count of Article Views (full-text article views including HTML views, PDF and ePub downloads, according to the available data) and Abstracts Views on Vision4Press platform.
Data correspond to usage on the plateform after 2015. The current usage metrics is available 48-96 hours after online publication and is updated daily on week days.
Initial download of the metrics may take a while.