Fig. 4
Download original image
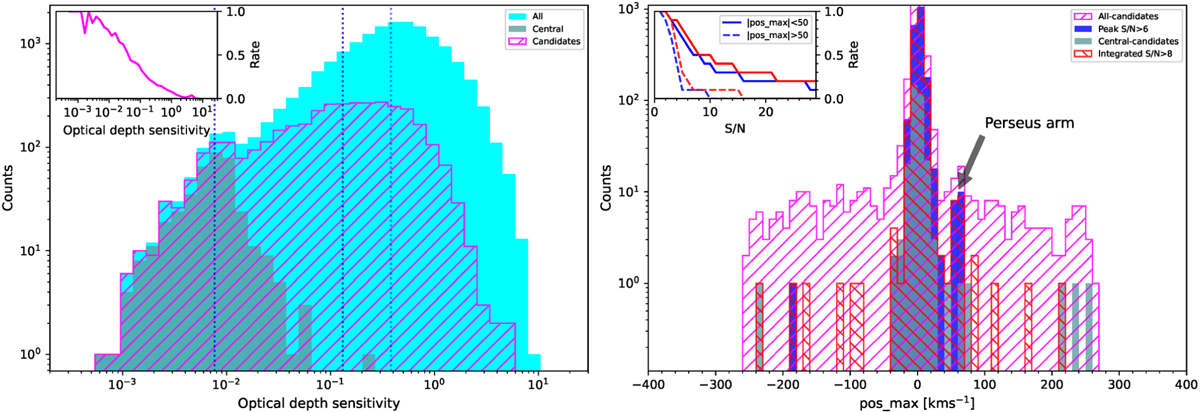
Left: optical depth sensitivity (τ3σ) for all (19 130; cyan) and central (390; gray) sight lines. Hatch-filled (“/”) histogram is for sight lines (3640) with absorption candidates. The vertical dotted lines represent median sensitivities for these three categories of sight lines. The inset shows overall candidate detection rate. Right: Positions of the absorption peak (pos_max) for all (‘/’), peak S/N>6 (blue), integrated S/N > 8 (red), and central (gray) candidates. The inset shows detection rates as a function of S/N for candidates with |pos_max| smaller and greater than 50 km s−1, respectively, for peak (blue) and integrated (red) optical depths. The sharp cutoffs at |pos_max| = 250 km s−1 correspond to the 500 km s−1 width of line search window. An independent automated search over |pos_max| = 250–500 km s−1 did not reveal any absorption features with peak S/N> 6. Only a marginal feature with ∫ τdv = 0.51 km s−1 is detected toward J224543.63+024015.3 at −300 km s−1.
Current usage metrics show cumulative count of Article Views (full-text article views including HTML views, PDF and ePub downloads, according to the available data) and Abstracts Views on Vision4Press platform.
Data correspond to usage on the plateform after 2015. The current usage metrics is available 48-96 hours after online publication and is updated daily on week days.
Initial download of the metrics may take a while.