Fig. 3
Download original image
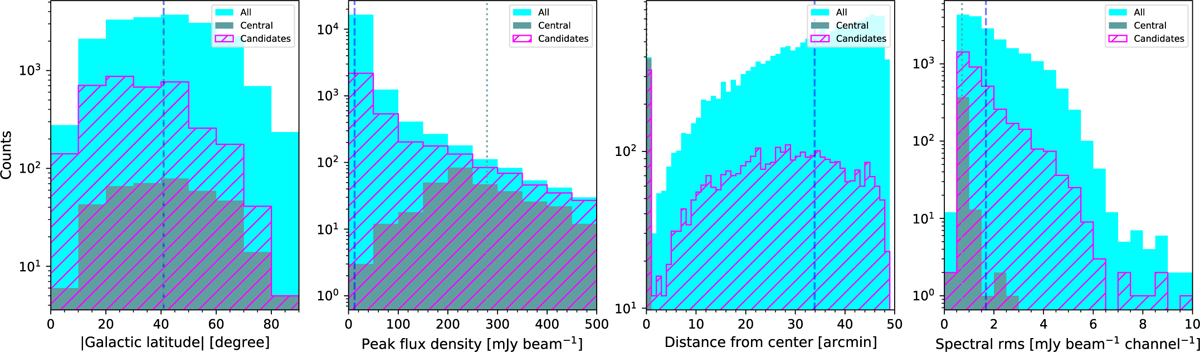
Distributions of Galactic latitude (Peak_pos_b), peak flux density (Peak_flux), distance from the pointing center (Distance_pointing) and spectral rms (Spec_rms) for 19130 sources (cyan) in logarithmic scales. The gray histogram shows the bright central targets, within 60″ of the pointing center. The vertical dashed and dotted lines mark median values for all sources and only central ones, respectively. The hatch-filled distributions represent candidates, i.e., detection counts uncorrected for false absorption features. For clarity in the second column, 176 targets with Peak_flux > 500 mJy beam−1 have been omitted.
Current usage metrics show cumulative count of Article Views (full-text article views including HTML views, PDF and ePub downloads, according to the available data) and Abstracts Views on Vision4Press platform.
Data correspond to usage on the plateform after 2015. The current usage metrics is available 48-96 hours after online publication and is updated daily on week days.
Initial download of the metrics may take a while.