Fig. C.2
Download original image
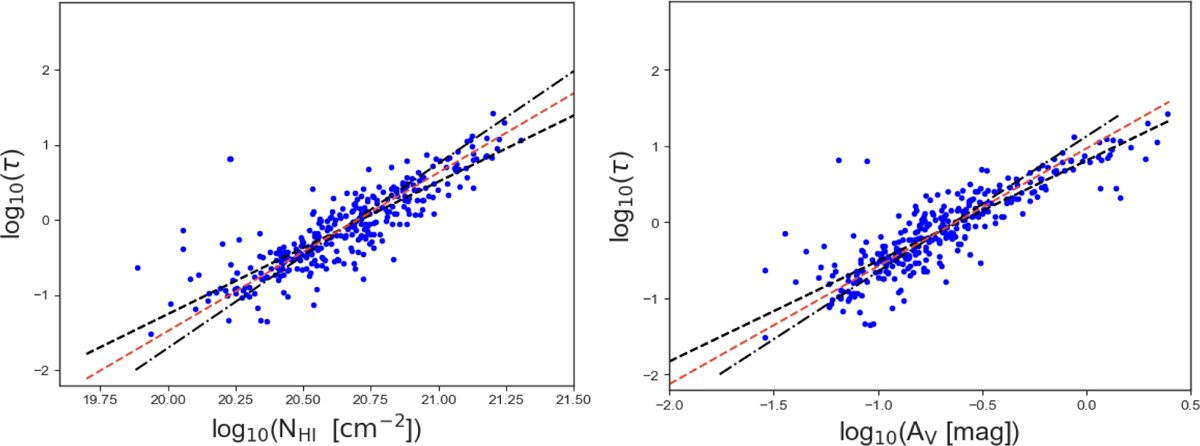
Left: ∫ τdv versus NHI(HI4PI) is plotted on a double logarithmic scale. The dashed and dash-dotted lines mark the range of uncertainty by fitting a linear function to the data values. The dashed red line represents the average of both least-square approximations. From this we calculated the correlation coefficient of 0.89 and a scaling relation of ![]() . Right: Same as left but instead of NHI, the dependence of ∫ τdv from AV is displayed. Here, the correlation coefficient is 0.85 and the scaling relation is
. Right: Same as left but instead of NHI, the dependence of ∫ τdv from AV is displayed. Here, the correlation coefficient is 0.85 and the scaling relation is ![]() .
.
Current usage metrics show cumulative count of Article Views (full-text article views including HTML views, PDF and ePub downloads, according to the available data) and Abstracts Views on Vision4Press platform.
Data correspond to usage on the plateform after 2015. The current usage metrics is available 48-96 hours after online publication and is updated daily on week days.
Initial download of the metrics may take a while.