Fig. C.1
Download original image
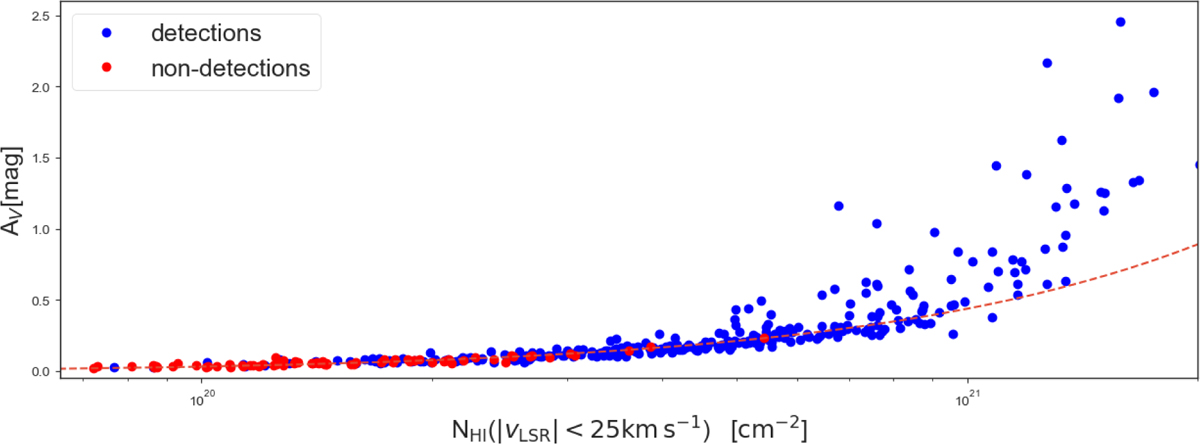
Linear correlation between AV) and NHI(HI4PI) toward central lines of sight without absorption detections (red) and with absorption detections (blue). The dashed lines show the best fit result of the least square approximation given in Eq. (6). Note, sight lines with and without the detection of an H I absorption line populate the lower but largely overlapping column densities.
Current usage metrics show cumulative count of Article Views (full-text article views including HTML views, PDF and ePub downloads, according to the available data) and Abstracts Views on Vision4Press platform.
Data correspond to usage on the plateform after 2015. The current usage metrics is available 48-96 hours after online publication and is updated daily on week days.
Initial download of the metrics may take a while.