Fig. B.1
Download original image
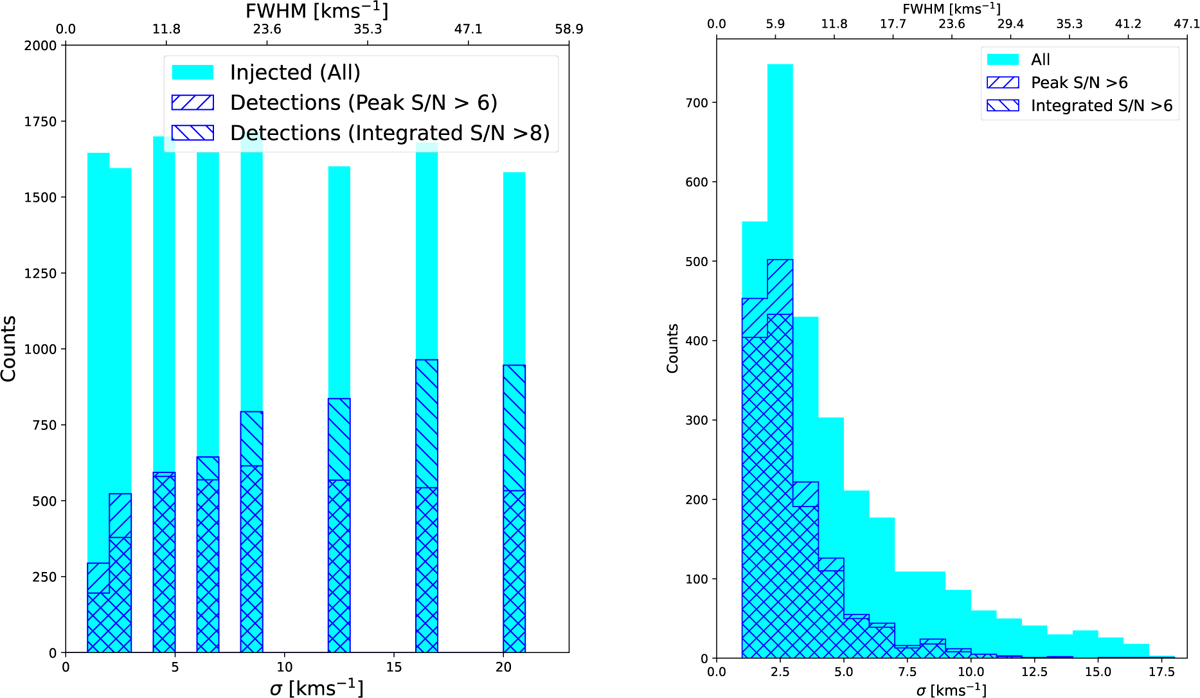
Left: Distributions of line width (σ) of injected absorption lines and detections for peak and integrated S/N cutoffs adopted for the MALS sample. In general, for absorption features with single Gaussian component fits, integrated S/N = peak S/N × ![]() . Right: Distributions of line width of 2986 MALS absorbers fit with single Gaussian components.
. Right: Distributions of line width of 2986 MALS absorbers fit with single Gaussian components.
Current usage metrics show cumulative count of Article Views (full-text article views including HTML views, PDF and ePub downloads, according to the available data) and Abstracts Views on Vision4Press platform.
Data correspond to usage on the plateform after 2015. The current usage metrics is available 48-96 hours after online publication and is updated daily on week days.
Initial download of the metrics may take a while.