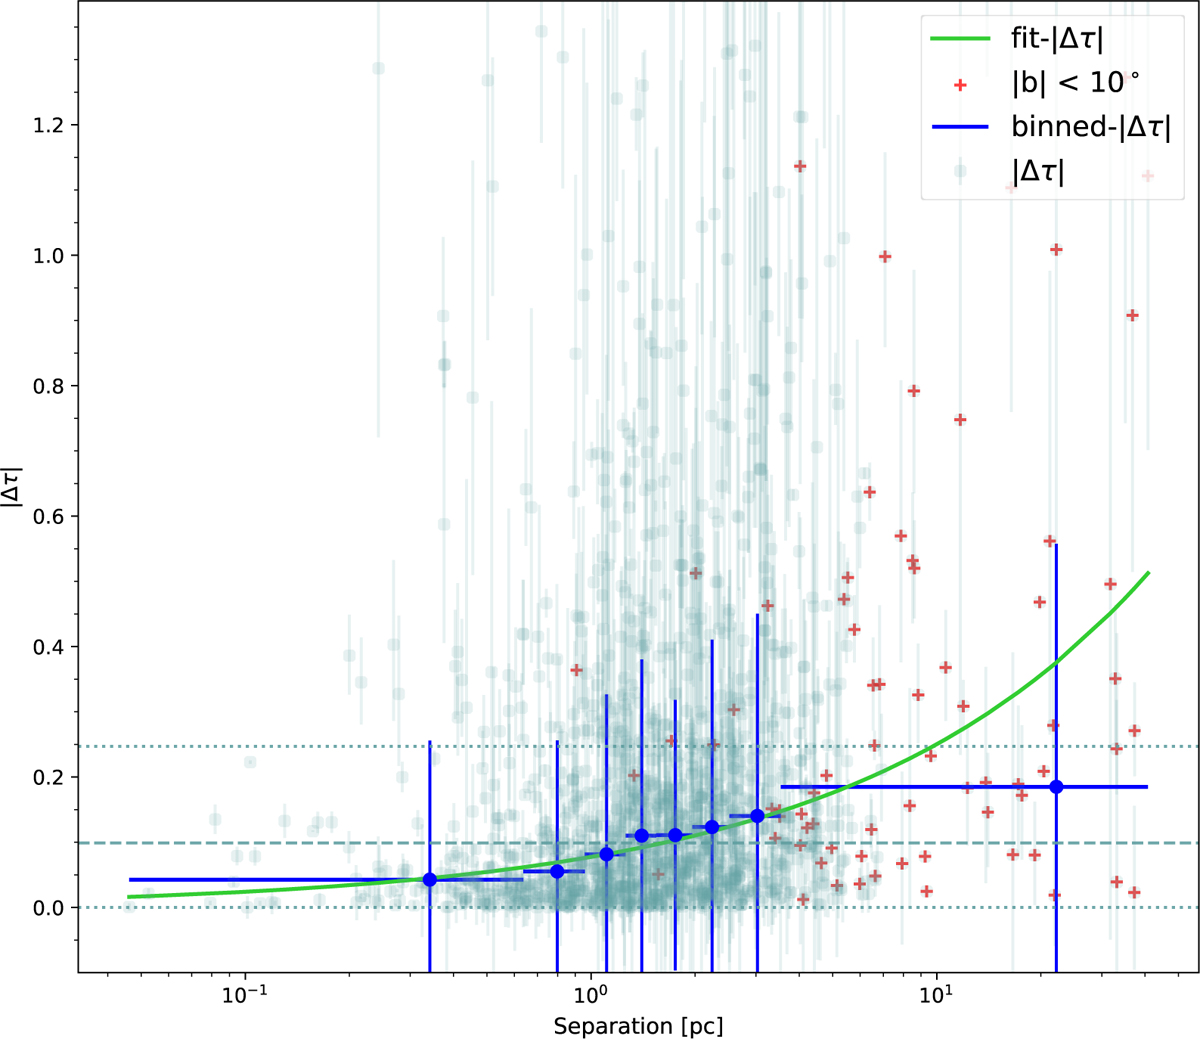
Fig. 22
Download original image
|Δτ| versus separation in parsec between central and off-axis sight lines for absorption lines matched within ±6 km s−1. The horizontal dashed line marks median |Δτ|, and dotted lines represent 1σ scatter based on the median absolute deviation. The median |Δτ| in equal frequency bins with 1σ scatter which are essentially Δτrms, are also shown. The 1σ uncertainty on averaged |Δτ| per bin is 0.02 and not shown. The measurements at |b|< 10° are marked as ‘+’. The power law fit to |Δτ| at |b|> 10° is also shown. For clarity, 9 measurements in the range 1.39 < |Δτ| < 2.53 have been omitted from the plot.
Current usage metrics show cumulative count of Article Views (full-text article views including HTML views, PDF and ePub downloads, according to the available data) and Abstracts Views on Vision4Press platform.
Data correspond to usage on the plateform after 2015. The current usage metrics is available 48-96 hours after online publication and is updated daily on week days.
Initial download of the metrics may take a while.