Fig. 19
Download original image
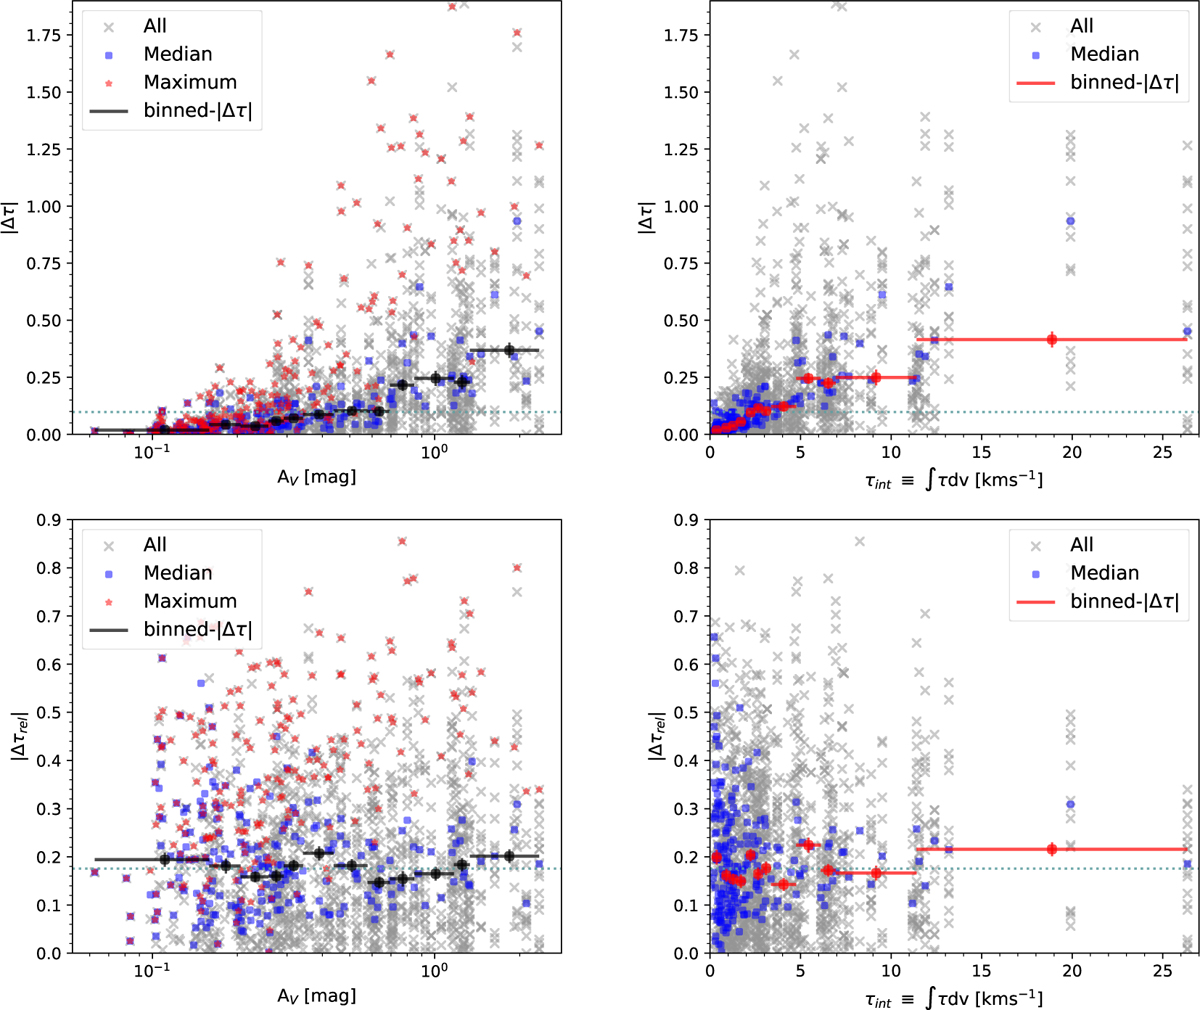
Top: |Δτ| (Eq. (9)) versus AV (left) and τint ≡ ∫ τdv (right) for the central+off-axis subset, with the horizontal dashed line showing the median value. Note that AV and τint are measured toward pointing centers. Also shown are median and maximum of |Δτ| per pointing, and median |Δτ| in equal frequency bins. The 1σ uncertainty on averaged |Δτ| per bin is too small and not shown. For clarity, one measurement with |Δτ| = 2.53 is omitted from the plot. Bottom: |Δτrel| (Eq. (10)) versus AV (left) and τint ≡ ∫ τdv (right). For clarity, one measurement with |Δτrel| = 1.66 is omitted from the plot. The remaining details are same as top panels.
Current usage metrics show cumulative count of Article Views (full-text article views including HTML views, PDF and ePub downloads, according to the available data) and Abstracts Views on Vision4Press platform.
Data correspond to usage on the plateform after 2015. The current usage metrics is available 48-96 hours after online publication and is updated daily on week days.
Initial download of the metrics may take a while.