Fig. 17
Download original image
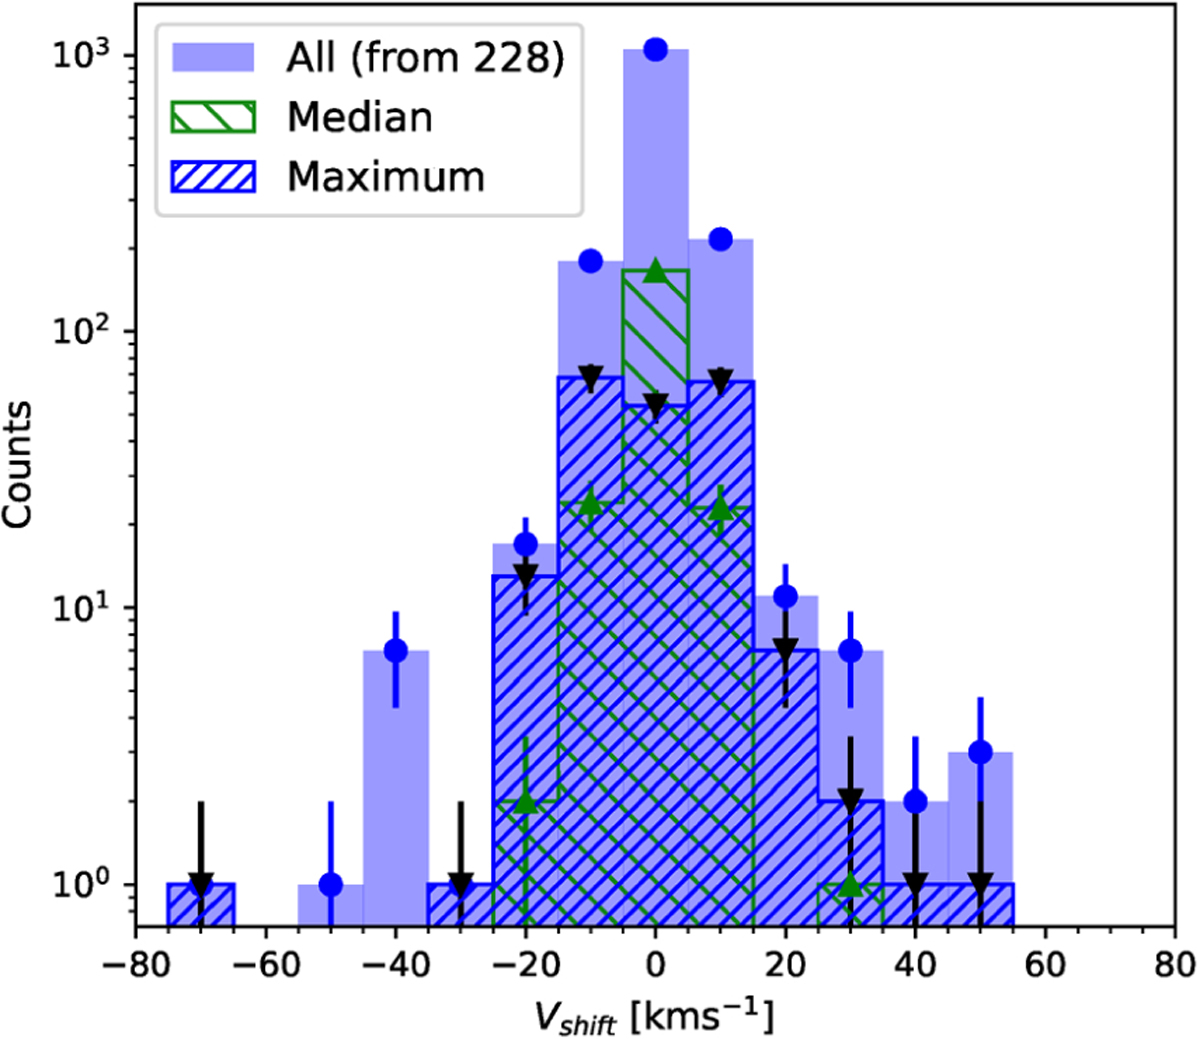
Distributions of change in absorption peak (Vshift; Eq. (8)) for the subset of 228 pointings. Also shown are median and maximum Vshift per pointing. Two measurements at 150 and −180 km s−1 have been excluded for clarity (see text for details). The error bars correspond to ![]() . Of interest is that the velocity distribution mainly extends out only to the intermediate-velocity (IVC) regime. LVCs and IVC are both objects of the infrared cirrus. This implies that they belong to the region below the disk halo interface (Crovisier et al. 1985).
. Of interest is that the velocity distribution mainly extends out only to the intermediate-velocity (IVC) regime. LVCs and IVC are both objects of the infrared cirrus. This implies that they belong to the region below the disk halo interface (Crovisier et al. 1985).
Current usage metrics show cumulative count of Article Views (full-text article views including HTML views, PDF and ePub downloads, according to the available data) and Abstracts Views on Vision4Press platform.
Data correspond to usage on the plateform after 2015. The current usage metrics is available 48-96 hours after online publication and is updated daily on week days.
Initial download of the metrics may take a while.