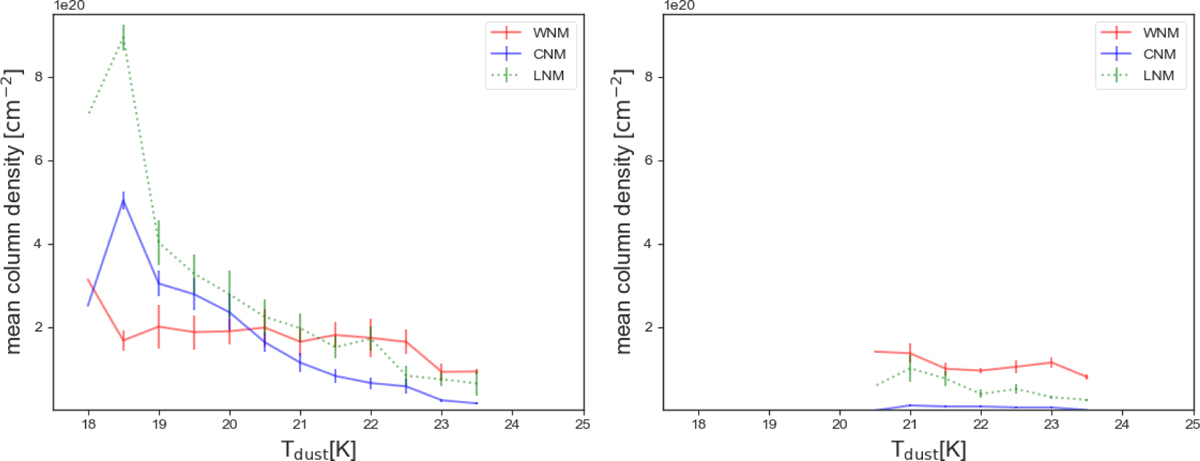
Fig. 13
Download original image
NHI of WNM, CNM, and LNM over the column density interval 0.03 · 1020 ≤ NHI cm−2 ≤ 9.5 · 1020 according to Kalberla & Haud (2018) versus Tdust in bins of 0.5 K for central sight lines with H I 21-cm absorption detections (left) and non-detections (right). The error bars represent the scatter as the median absolute deviation (MAD), corresponding to 0.68σ for normally distributed data.
Current usage metrics show cumulative count of Article Views (full-text article views including HTML views, PDF and ePub downloads, according to the available data) and Abstracts Views on Vision4Press platform.
Data correspond to usage on the plateform after 2015. The current usage metrics is available 48-96 hours after online publication and is updated daily on week days.
Initial download of the metrics may take a while.