Fig. 12
Download original image
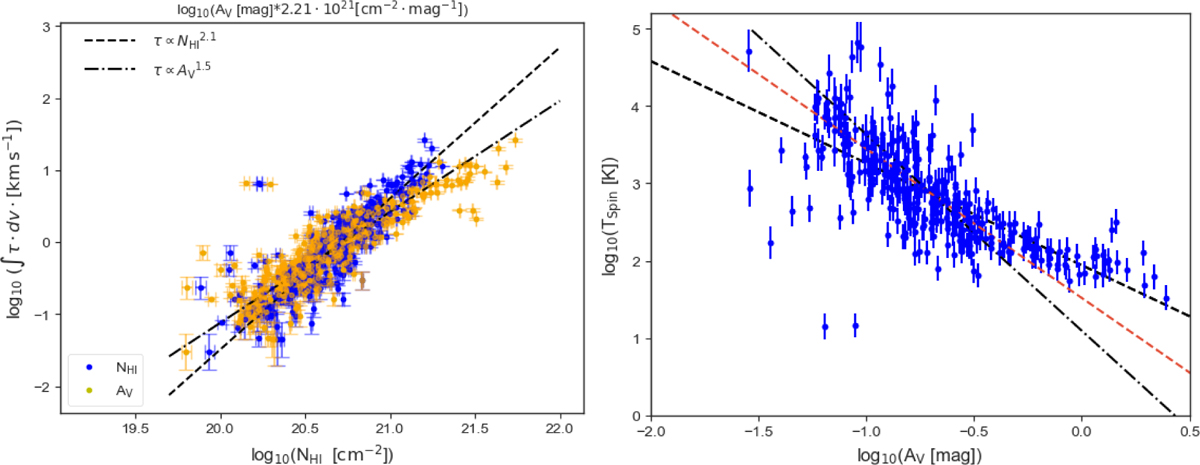
Left: ∫ τdv (MALS) versus NHI (HI4PI; blue dots) or ![]() (yellow dots; based on Eq. (6)) is plotted on a double logarithmic scale. The two regression lines, both with correlation coefficients of 0.89 and 0.85 respectively, are plotted as dashed and dash-dotted lines (see text for details). The error bars on H I column density correspond to HI4PI 3σ detection levels, whereas the error bars in the y direction are based on uncertainties in tau_int_val. Right: TSpin (see Eq. (7)) versus AV on a double logarithmic scale. The dashed and dash-dotted lines mark the range of uncertainty by fitting a linear function to the data values. The dashed red line represents the average of both least-square approximations.
(yellow dots; based on Eq. (6)) is plotted on a double logarithmic scale. The two regression lines, both with correlation coefficients of 0.89 and 0.85 respectively, are plotted as dashed and dash-dotted lines (see text for details). The error bars on H I column density correspond to HI4PI 3σ detection levels, whereas the error bars in the y direction are based on uncertainties in tau_int_val. Right: TSpin (see Eq. (7)) versus AV on a double logarithmic scale. The dashed and dash-dotted lines mark the range of uncertainty by fitting a linear function to the data values. The dashed red line represents the average of both least-square approximations.
Current usage metrics show cumulative count of Article Views (full-text article views including HTML views, PDF and ePub downloads, according to the available data) and Abstracts Views on Vision4Press platform.
Data correspond to usage on the plateform after 2015. The current usage metrics is available 48-96 hours after online publication and is updated daily on week days.
Initial download of the metrics may take a while.