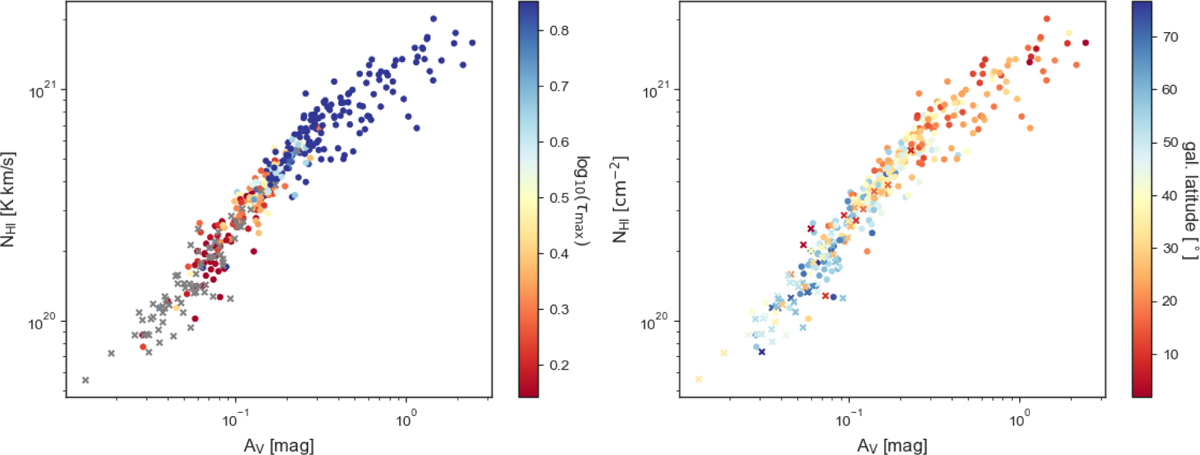
Fig. 11
Download original image
Double logarithmic plot displaying NHI versus optical extinction AV for central sight lines. The optical extinction is calculated with R(V) = 3.1 (Gordon et al. 2003) and applying correction factor from Schlafly & Finkbeiner (2011) to the SFD data. NHI is determined from HI4PI. The dots and crosses represent H I absorption detections and non-detections, respectively. To guide the eye, the dashed line representing the best fit gas-to-dust ratio (Eq. (6)) is plotted in the left panel. The color coding represents the peak H I optical depth (tau_max_val; left panel) and the absolute value of Galactic latitude (Peak_pos_b; right panel).
Current usage metrics show cumulative count of Article Views (full-text article views including HTML views, PDF and ePub downloads, according to the available data) and Abstracts Views on Vision4Press platform.
Data correspond to usage on the plateform after 2015. The current usage metrics is available 48-96 hours after online publication and is updated daily on week days.
Initial download of the metrics may take a while.