Fig. 1
Download original image
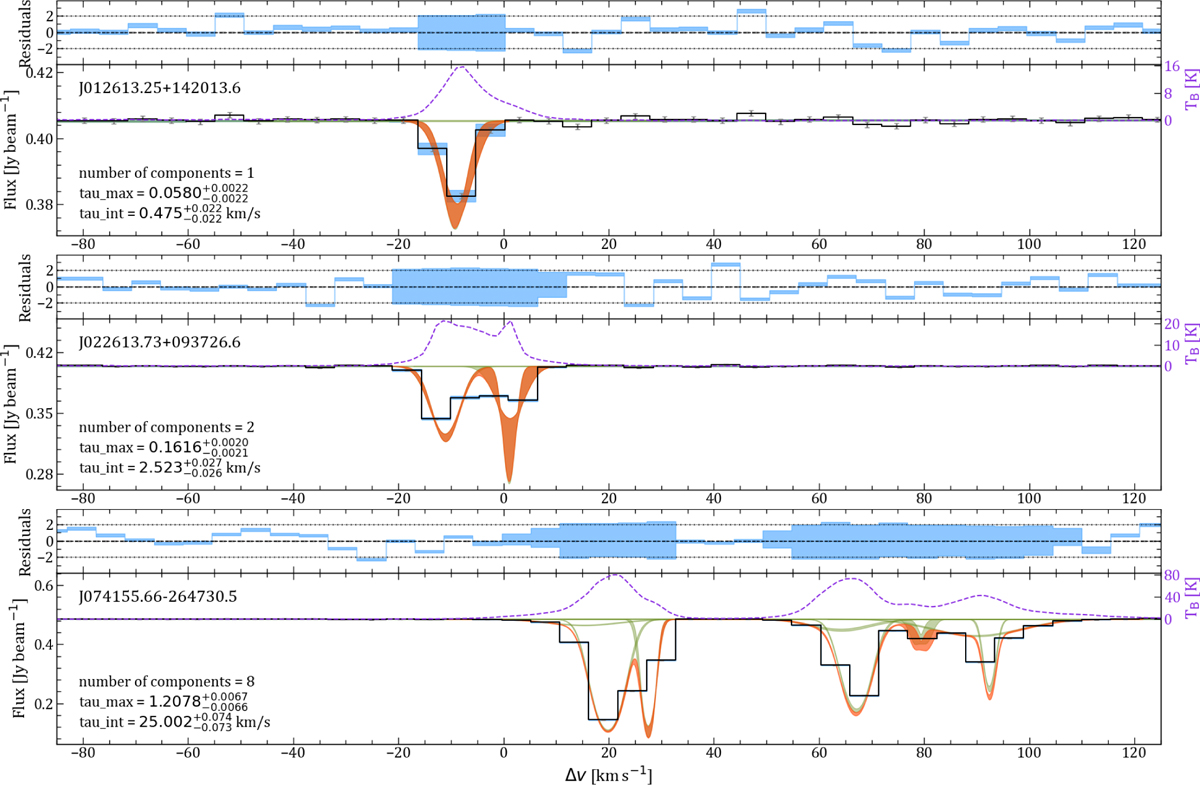
Examples of H I line profile fits to the spectra toward J012613.25+142013.6 (top), J022613.73+093726.6 (middle), and J074155.66–264730.5 (bottom). The black line shows the unsmoothed spectrum with a pixel size of 5.5 km s−1. The red and green filled regions indicate the total and individual components, respectively. The blue step-like regions indicate the total model profile integrated in bins. The model profiles are represented as 0.05..0.95 interquantile region of the unbinned model profile drawn from the posterior distribution function of the model parameters constrained during MCMC fit to the data (see Sect. 2.3). The dashed violet line indicate the H I emission profiles obtained using HI4PI survey near the position of the source. The upper panel show the 0.05..0.95 quantile regions of the residuals between the data and the model calculated using binned profiles. The text label in each panel indicates the derived global parameters of the profiles.
Current usage metrics show cumulative count of Article Views (full-text article views including HTML views, PDF and ePub downloads, according to the available data) and Abstracts Views on Vision4Press platform.
Data correspond to usage on the plateform after 2015. The current usage metrics is available 48-96 hours after online publication and is updated daily on week days.
Initial download of the metrics may take a while.