Open Access
Fig. 8
Download original image
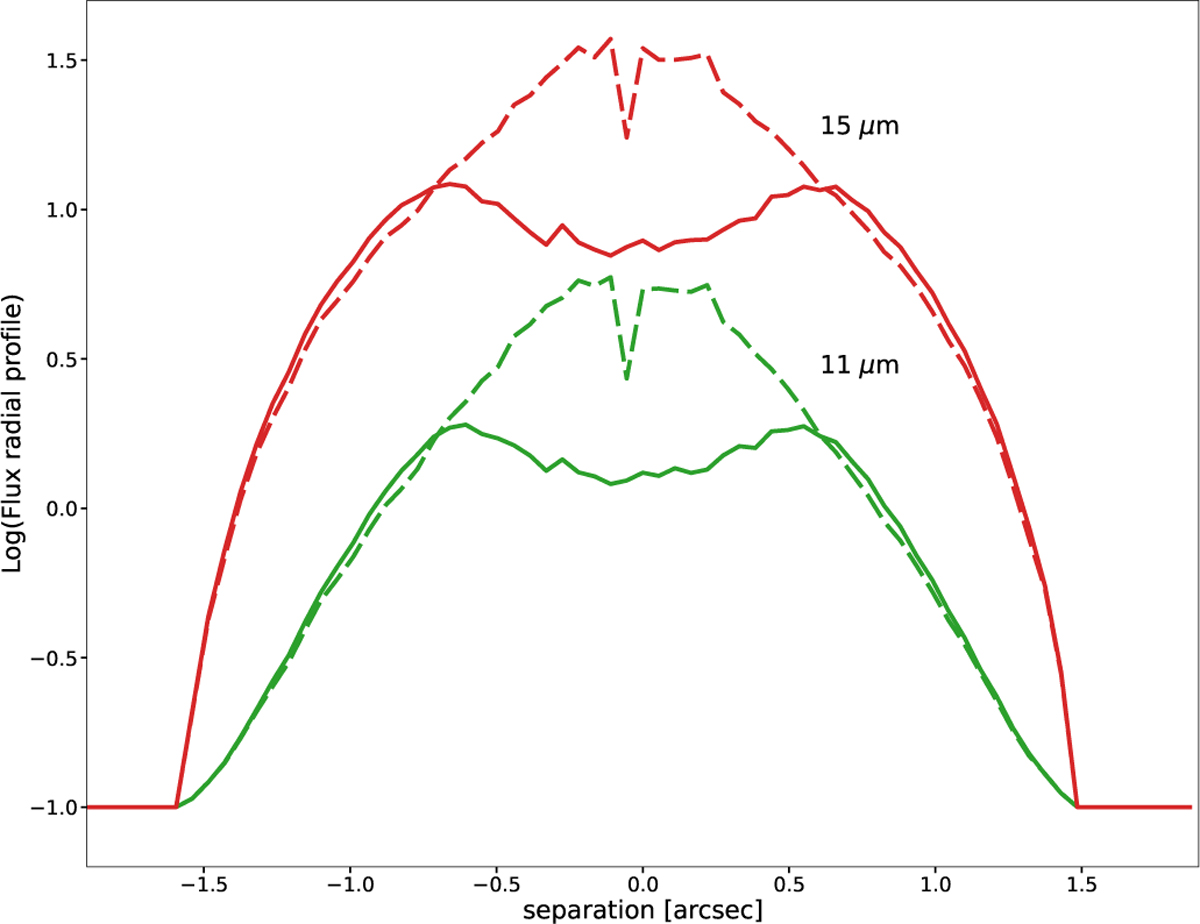
Intensity profiles at 11 (green) and 15 μm (red) derived from DDiT+ plotted as a dashed line in the nominal case (αin = 2, αout = −6) and as a solid line for αin = 6, αout = −6. This illustrates that the forward-modeling would be sensitive to the actual dust density profile.
Current usage metrics show cumulative count of Article Views (full-text article views including HTML views, PDF and ePub downloads, according to the available data) and Abstracts Views on Vision4Press platform.
Data correspond to usage on the plateform after 2015. The current usage metrics is available 48-96 hours after online publication and is updated daily on week days.
Initial download of the metrics may take a while.