Fig. 7
Download original image
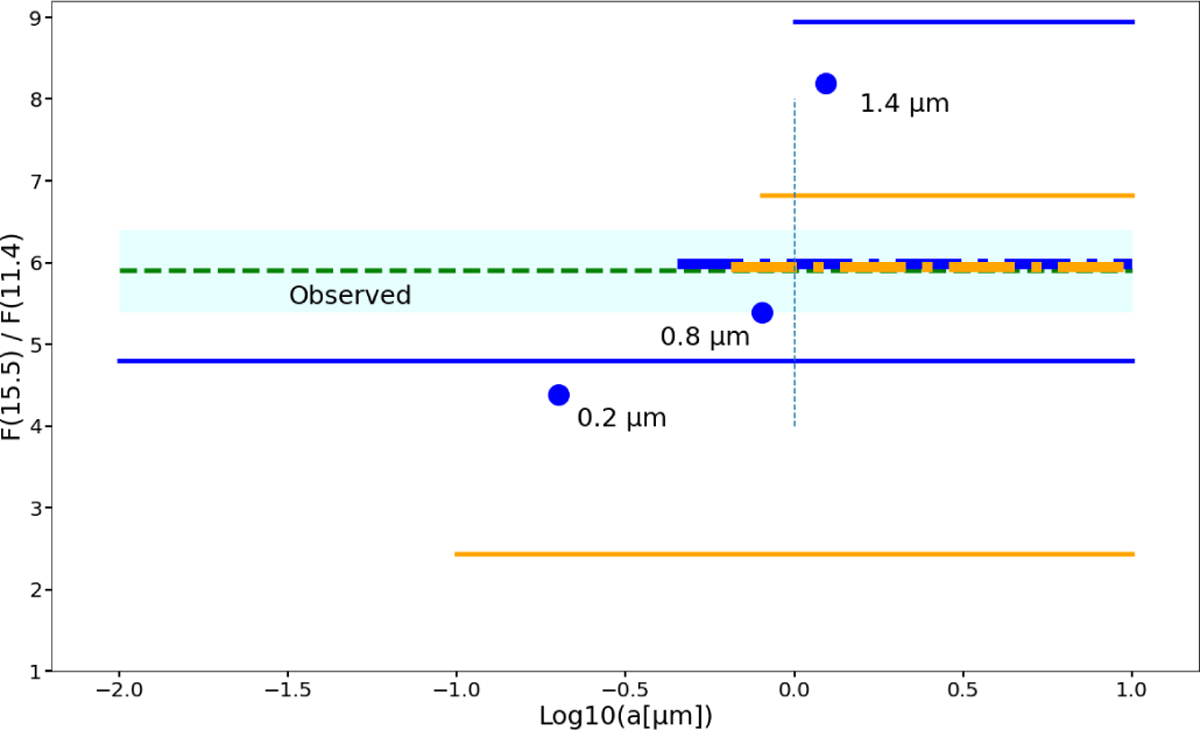
Dependence of the ratio Rf = F15.5/F11.4 on the grain size distribution. The ratio Rf is deduced from the model after integration of the flux in the considered size range. Rf is plotted for a selection of different size ranges, all following a distribution in a−3.5. Each segment depicts a range that is plotted in blue for silicate grains and in orange for graphite grains. The dots correspond to single sizes of silicate grains. The two retained ranges are indicated by thicker dash-dot segments. The range of ratios deduced from observations is indicated by shaded cyan rectangle.
Current usage metrics show cumulative count of Article Views (full-text article views including HTML views, PDF and ePub downloads, according to the available data) and Abstracts Views on Vision4Press platform.
Data correspond to usage on the plateform after 2015. The current usage metrics is available 48-96 hours after online publication and is updated daily on week days.
Initial download of the metrics may take a while.