Fig. 3
Download original image
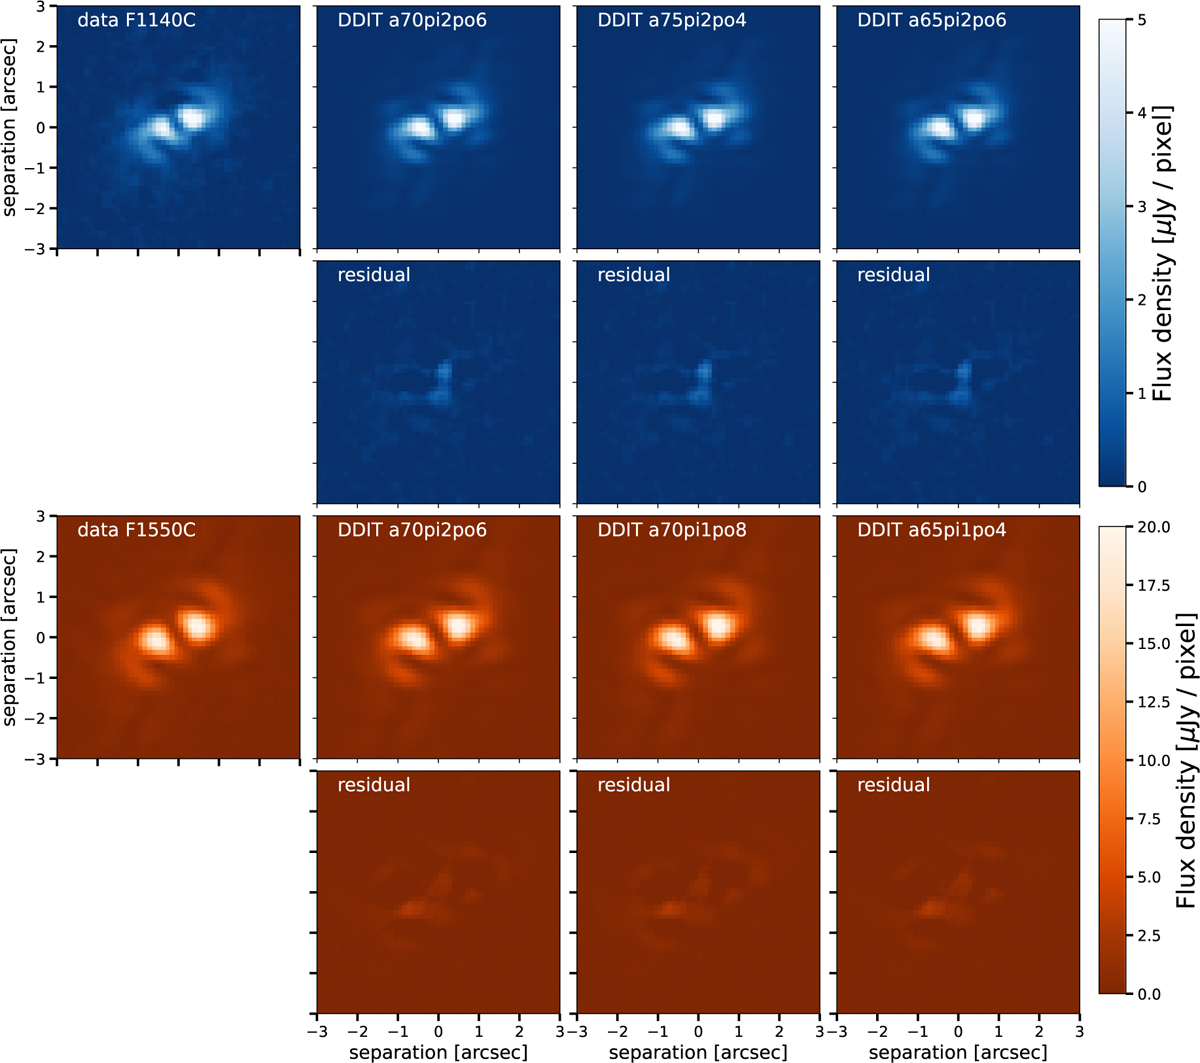
Comparison of simulated coronagraphic images and the observed image for a few cases for which the set of parameters αin, αout, and Rc led to a rather good solution, as indicated by the low residue level (second row of each set). The two upper rows correspond to the F1140C filter, and the two bottom rows show the F1550C filter. The label at the top of each image lists the values of the parameters in short. For example, a65pi1po4 stands for Rc = 65 au, αin = 1, and αout = −4.
Current usage metrics show cumulative count of Article Views (full-text article views including HTML views, PDF and ePub downloads, according to the available data) and Abstracts Views on Vision4Press platform.
Data correspond to usage on the plateform after 2015. The current usage metrics is available 48-96 hours after online publication and is updated daily on week days.
Initial download of the metrics may take a while.