Open Access
Fig. C.1
Download original image
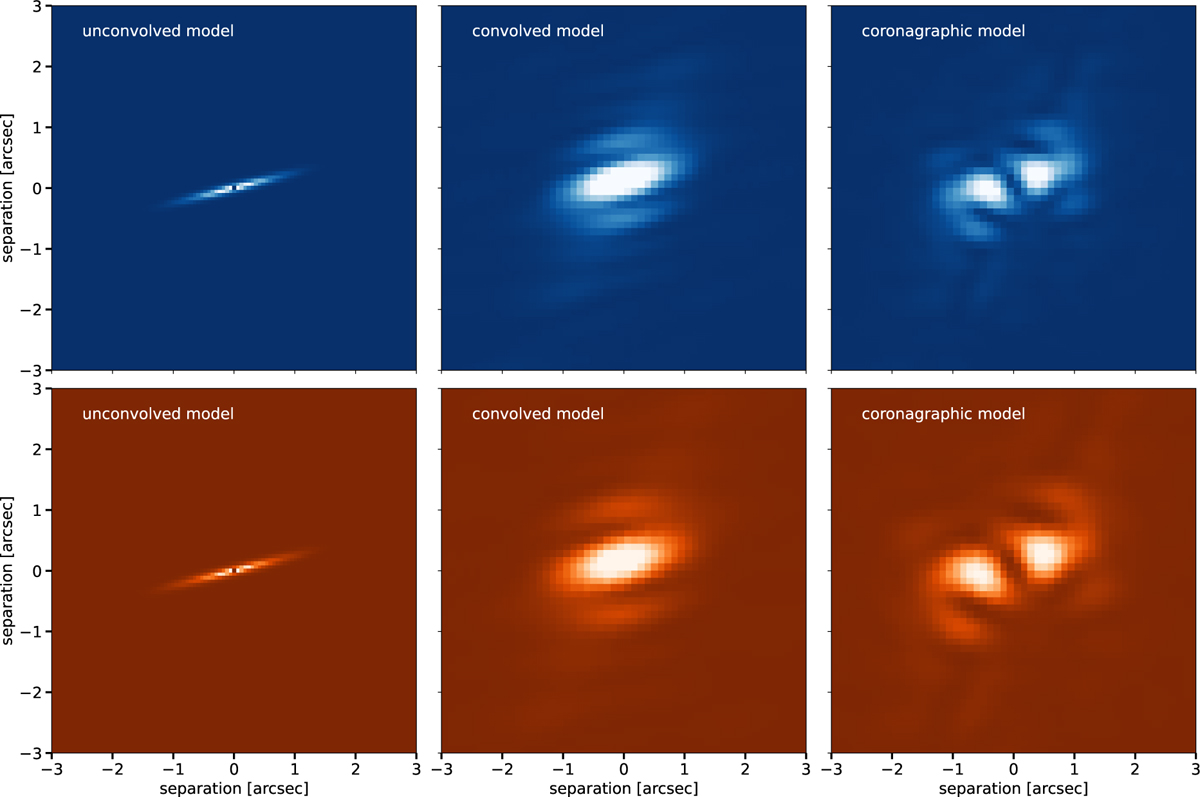
Illustration of the different steps of the simulation of synthetic disk images for the two filters (F1140C at the top, F1550C at the bottom). From left to right: DDiT+ disk model, non-coronagraphic image, coronagraphic image).
Current usage metrics show cumulative count of Article Views (full-text article views including HTML views, PDF and ePub downloads, according to the available data) and Abstracts Views on Vision4Press platform.
Data correspond to usage on the plateform after 2015. The current usage metrics is available 48-96 hours after online publication and is updated daily on week days.
Initial download of the metrics may take a while.