Fig. 6
Download original image
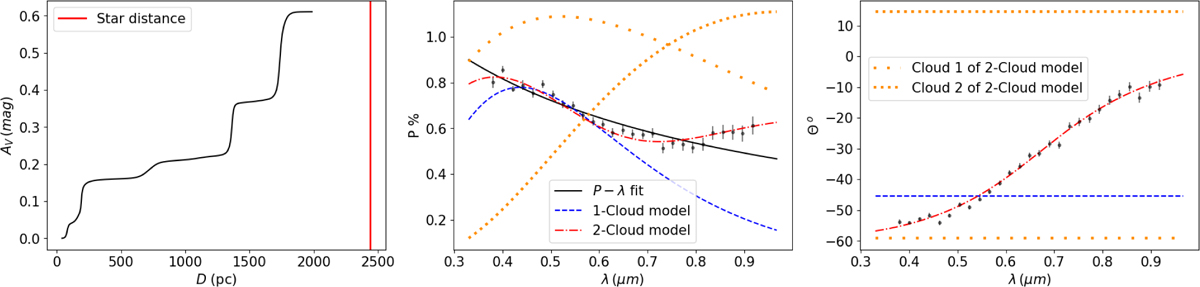
Example of a case in which both the P - λ and the θ - λ profiles deviate from Serkowski expectations. We were able to fit both profiles by introducing a 2-Cloud model. Data from Bagnulo et al. (2017) for HD 93222. Left: extinction vs. distance profile taken from the 2kpc version of the map by Edenhofer et al. (2024). The vertical red line corresponds to the distance of the source. Middle: data in the P - λ space, together with three fit models. Solid black line: Fit using Eq. (1) in P - λ space only. Dashed blue line: Best-fit 1-Cloud model in the q - u space (Eq. (6)). Dash-dotted red line: Best-fit 2-Cloud model in the q - u space (Eq. (6)). Dotted orange lines correspond to the two individual components of the 2-Cloud model. Right: data in θ - λ space together with the three models and the individual components of the 2-Cloud model. Parameters of the fits are quoted in Table 2.
Current usage metrics show cumulative count of Article Views (full-text article views including HTML views, PDF and ePub downloads, according to the available data) and Abstracts Views on Vision4Press platform.
Data correspond to usage on the plateform after 2015. The current usage metrics is available 48-96 hours after online publication and is updated daily on week days.
Initial download of the metrics may take a while.