Fig. 3
Download original image
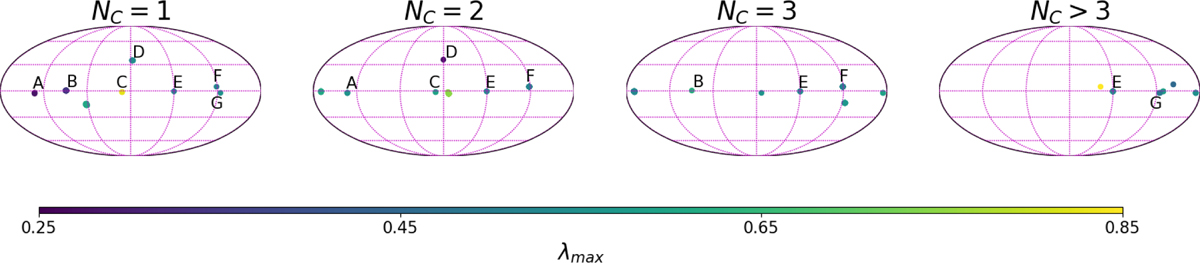
Positions of targets depending on their NC. Maps are in Galactic coordinates, in mollweide projection, centered on (0,0). Parallels are drawn every 30°. Meridians are drawn every 60°. Longitude increases toward the right-hand side. Colors correspond to the average λmax of each area. Areas marked with “A” through “G” contain stars that are located behind a single cloud and multiple clouds. See discussion in Sect. 4.3.
Current usage metrics show cumulative count of Article Views (full-text article views including HTML views, PDF and ePub downloads, according to the available data) and Abstracts Views on Vision4Press platform.
Data correspond to usage on the plateform after 2015. The current usage metrics is available 48-96 hours after online publication and is updated daily on week days.
Initial download of the metrics may take a while.