Fig. 2
Download original image
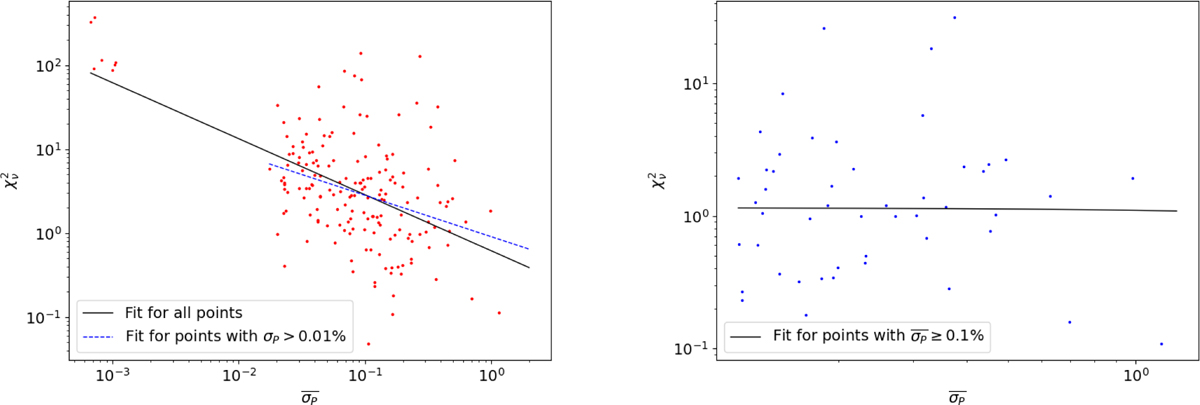
Left: average reported uncertainties in polarization, ![]() , versus
, versus ![]() for targets that survive the cuts described in Sect. 3.1, but without any restriction for the error bars. The black line is a linear fit for all the data in log-log space. The dashed blue line is similar, but excluding the points in the top left of the plot. Right: similar to left, but with the restriction for the error bars of σP ≥ 0.1%.
for targets that survive the cuts described in Sect. 3.1, but without any restriction for the error bars. The black line is a linear fit for all the data in log-log space. The dashed blue line is similar, but excluding the points in the top left of the plot. Right: similar to left, but with the restriction for the error bars of σP ≥ 0.1%.
Current usage metrics show cumulative count of Article Views (full-text article views including HTML views, PDF and ePub downloads, according to the available data) and Abstracts Views on Vision4Press platform.
Data correspond to usage on the plateform after 2015. The current usage metrics is available 48-96 hours after online publication and is updated daily on week days.
Initial download of the metrics may take a while.