Fig. 1
Download original image
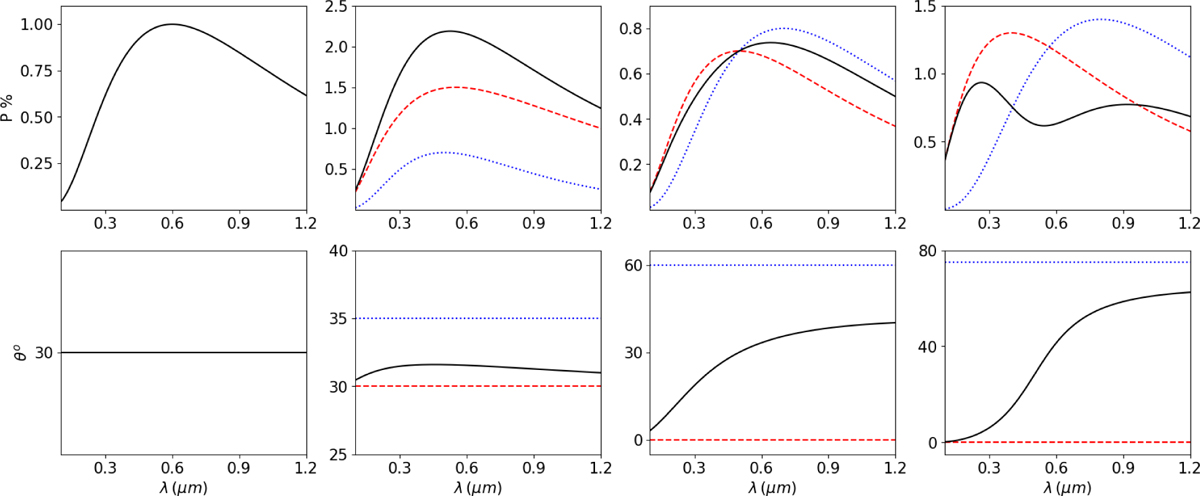
Demonstration of the effect of 3D structure in the Serkowski relation, using analytical models for P - λ and θ-λ curves. In each case, the solid black curve corresponds to the combined model and the dashed red and dotted blue lines correspond to individual clouds. Left column: simple case of one cloud (Eq. (1)). Middle left column: example with two clouds in the LOS, in which both the combined P-λ, and θ-λ seem to follow the Serkowski relation. Middle right column: example with two clouds in the LOS, in which the combined P-λ seems to follow the Serkowski relation, but θ - λ not. Right column: Example with two clouds in the LOS in which both P-λ and θ - λ profiles deviate from Serkowski expectations. The parameters for each model are: Left: Pmax = 1%, λmax = 0.6μιη. θ = 30°. Middle left: Pmax1 = 1.5%, λmax1 = 0.55 μm, θ1 = 30°, Pmax2 = 0.7%, λmax2 = 0.5 μm, θ2 = 35°. Middle right: Pmax1 = 0.7%, λmax1 = 0.5 μm, θ1 = 0°, Pmax2 = 0.8%, λmax2 = 0.7 μm, θ2 = 60°. Right: Pmax1 = 1.3%, λmax1 = 0.4 μm, θ1 = 0°, Pmax2 = 1.4%, λmax2 = 0.8 μm, θ2 = 75°. For all clouds, we have used K = 1.68·λmax (Wilking et al. 1980).
Current usage metrics show cumulative count of Article Views (full-text article views including HTML views, PDF and ePub downloads, according to the available data) and Abstracts Views on Vision4Press platform.
Data correspond to usage on the plateform after 2015. The current usage metrics is available 48-96 hours after online publication and is updated daily on week days.
Initial download of the metrics may take a while.