Fig. 2
Download original image
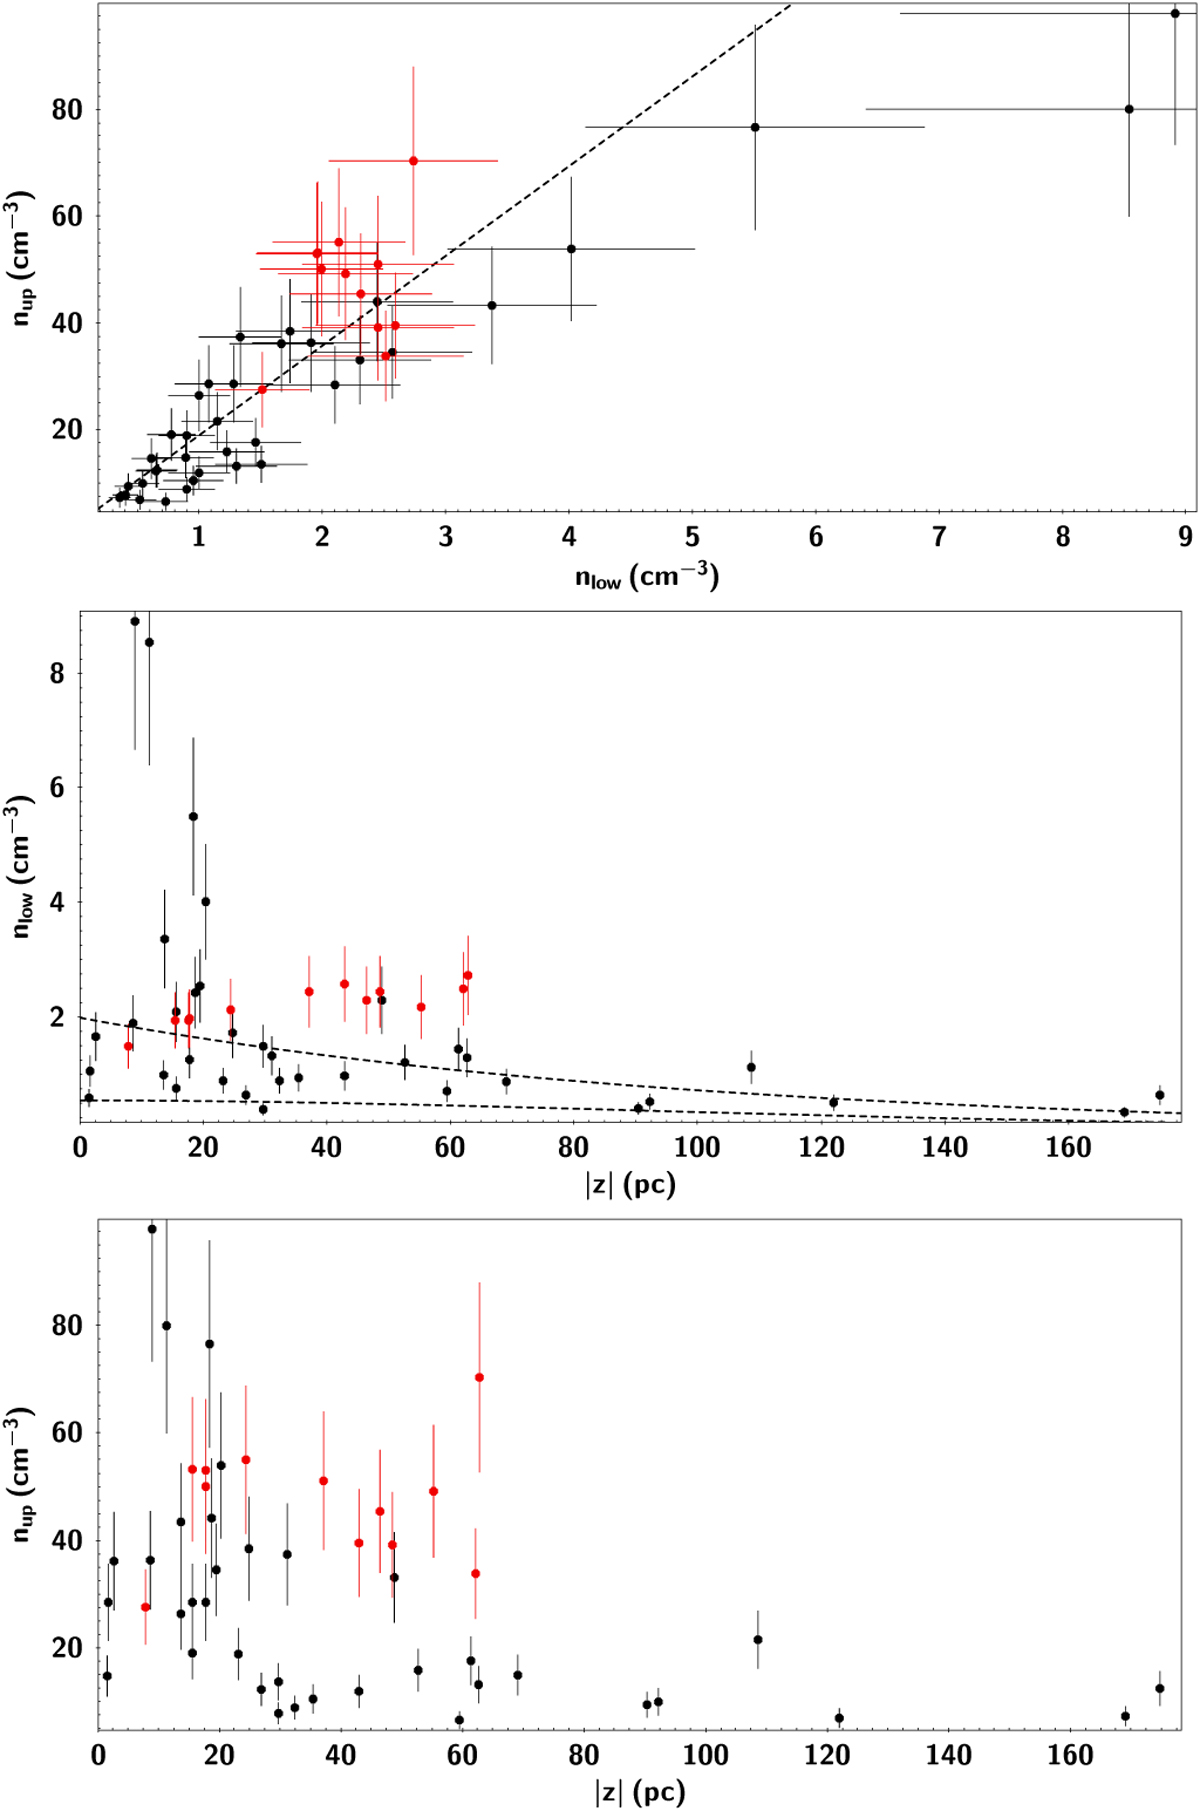
Local ISM density evaluation in the direction of the BS. The upper plot shows nup versus nlow. The fitted dashed line follows nup = 16.8 nlow + 2.3. The middle and lower plots show nlow and nup versus the distance above the Galactic plane, z, respectively. The dashed line draws the Dickey & Lockman 1990 and Loup et al. 1993 tendencies. In all the plots, the red points are the stars in the Cygnus X region (1 ~ 79°).
Current usage metrics show cumulative count of Article Views (full-text article views including HTML views, PDF and ePub downloads, according to the available data) and Abstracts Views on Vision4Press platform.
Data correspond to usage on the plateform after 2015. The current usage metrics is available 48-96 hours after online publication and is updated daily on week days.
Initial download of the metrics may take a while.