Fig. 1
Download original image
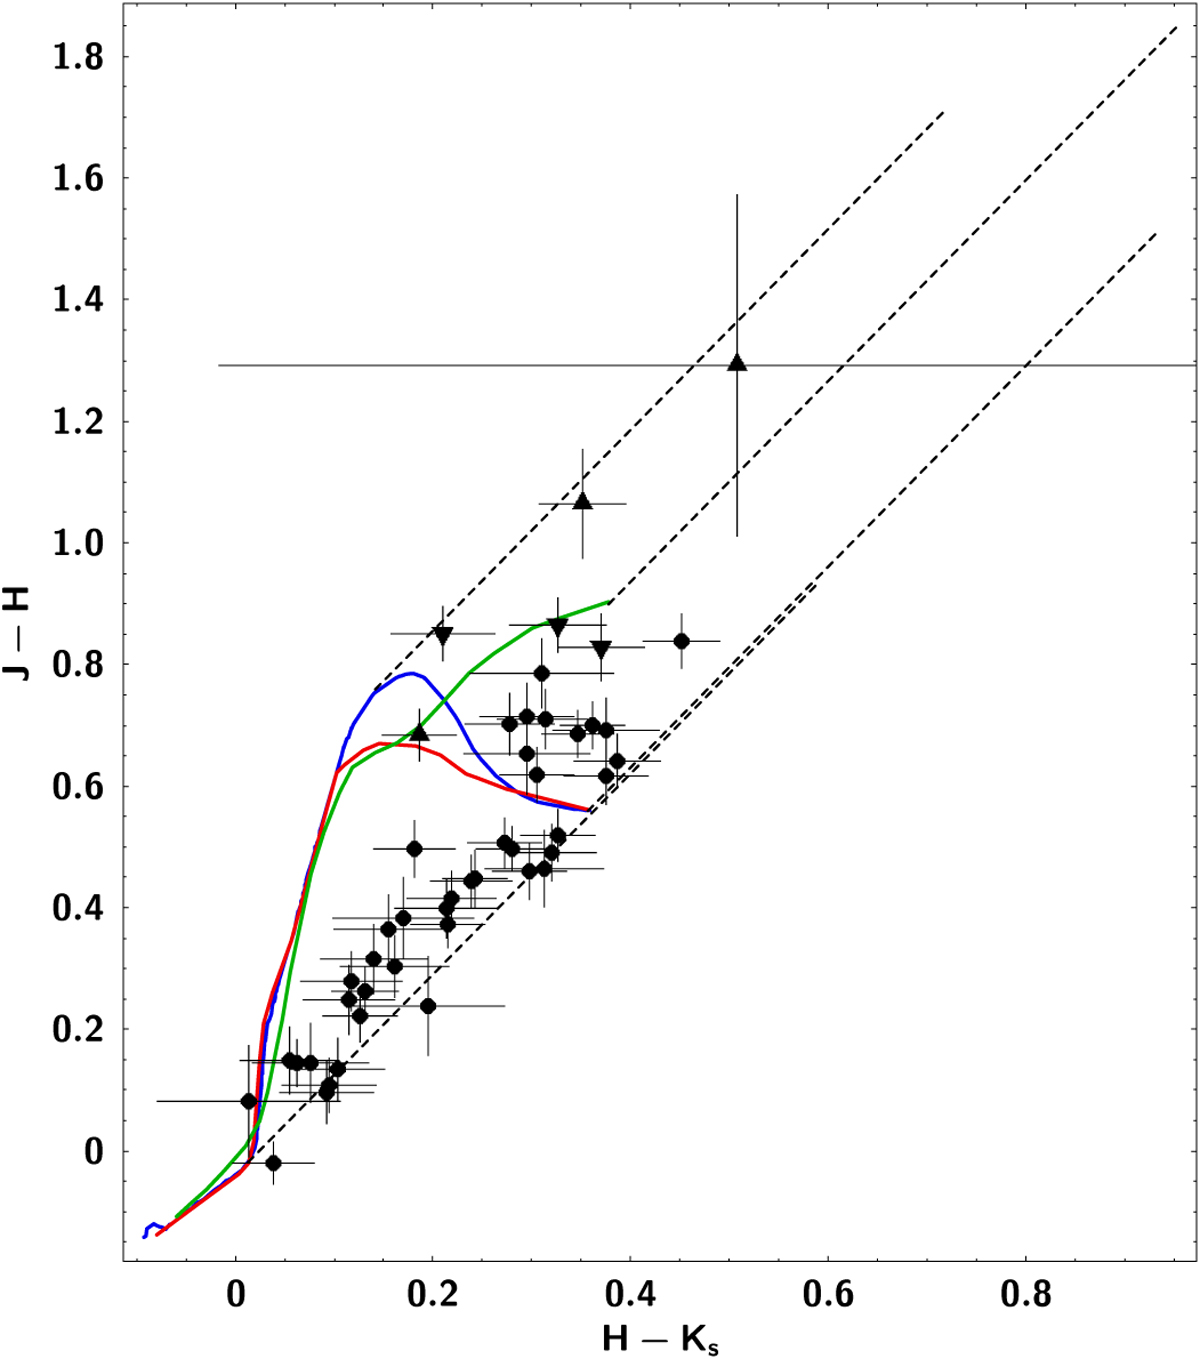
2MASS colour-colour diagram. The red, green, and blue lines represent the main sequence, supergiant and giant locations, respectively. These were built from the PARSEC evolutionary tracks8 with Solar metallicity. The dashed grey lines are 10 mag length reddening vectors. The upward and downward triangles are the classified cool stars (#1, #9, and #30) and the suspected cool ones (#3, #4, and #7), respectively.
Current usage metrics show cumulative count of Article Views (full-text article views including HTML views, PDF and ePub downloads, according to the available data) and Abstracts Views on Vision4Press platform.
Data correspond to usage on the plateform after 2015. The current usage metrics is available 48-96 hours after online publication and is updated daily on week days.
Initial download of the metrics may take a while.