Fig. 9.
Download original image
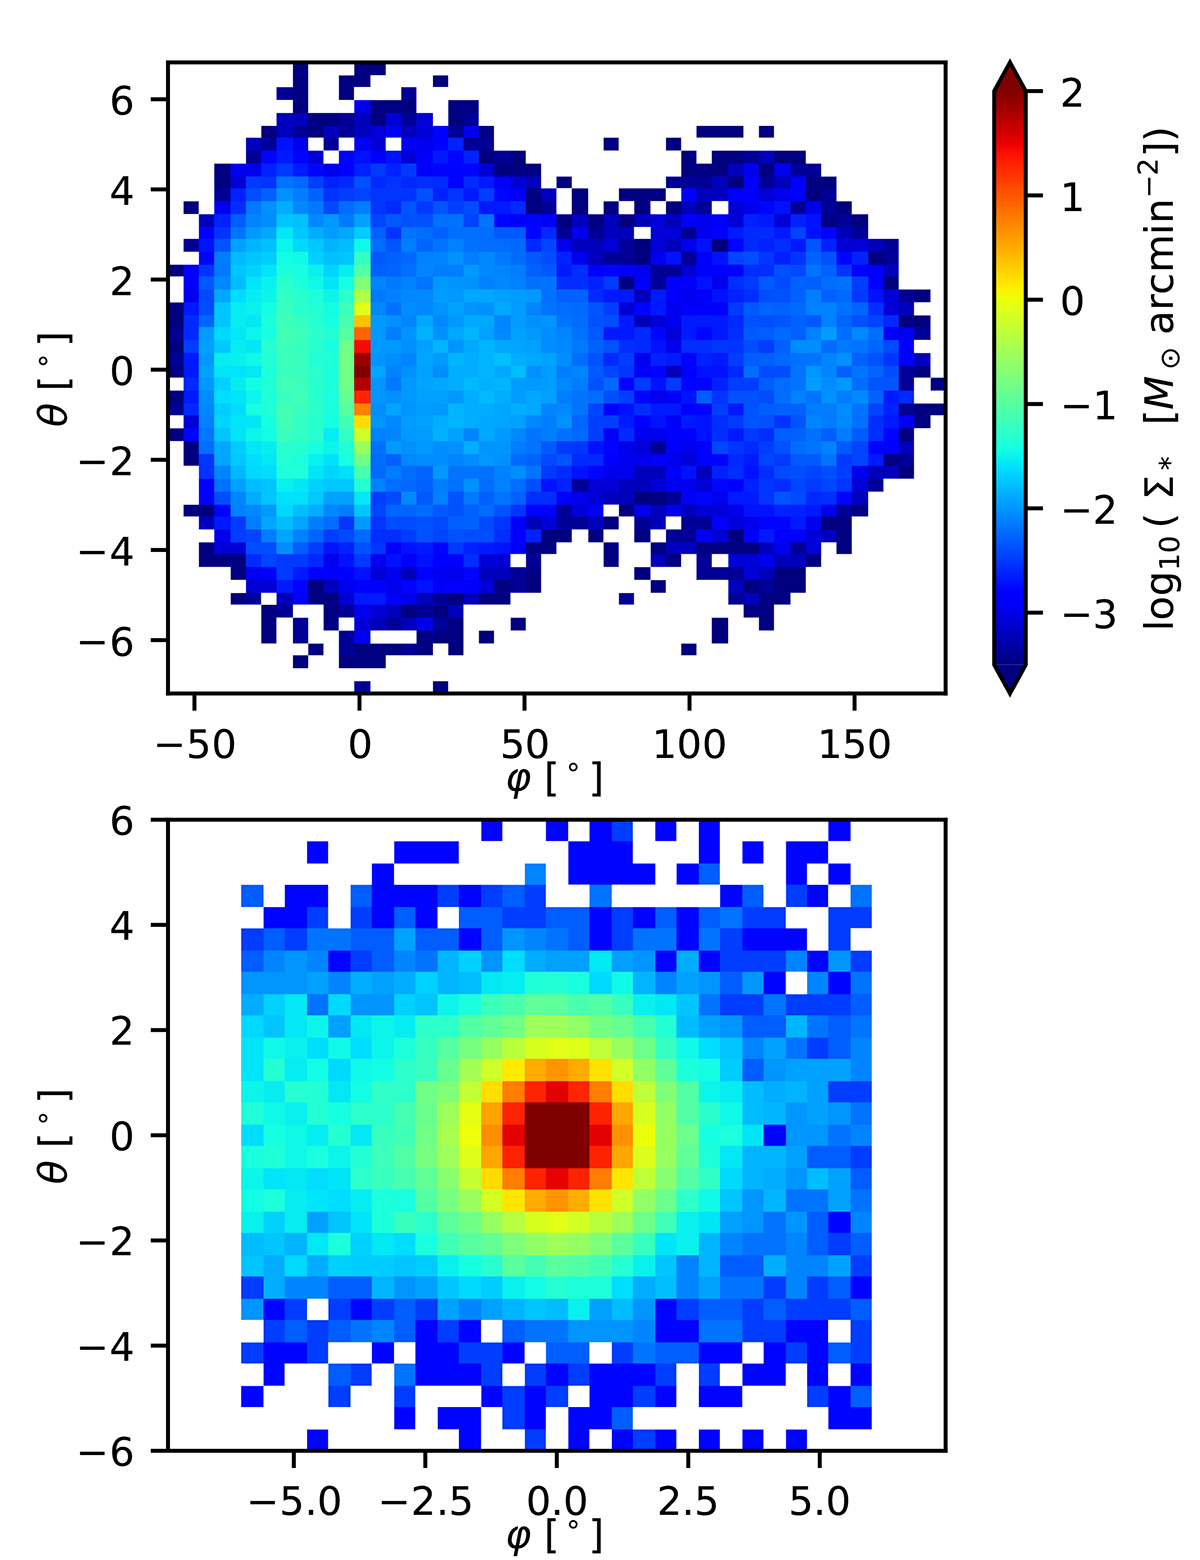
Simulated view of the predicted tidal stream of Fornax. The upper panel shows the whole stream. The color indicates the surface density of the stars. In these coordinates, Fornax moves to the right. Note that the vertical and the horizontal coordinates do not have the same aspect. The bottom panel only shows the vicinity of Fornax.
Current usage metrics show cumulative count of Article Views (full-text article views including HTML views, PDF and ePub downloads, according to the available data) and Abstracts Views on Vision4Press platform.
Data correspond to usage on the plateform after 2015. The current usage metrics is available 48-96 hours after online publication and is updated daily on week days.
Initial download of the metrics may take a while.