Fig. 6.
Download original image
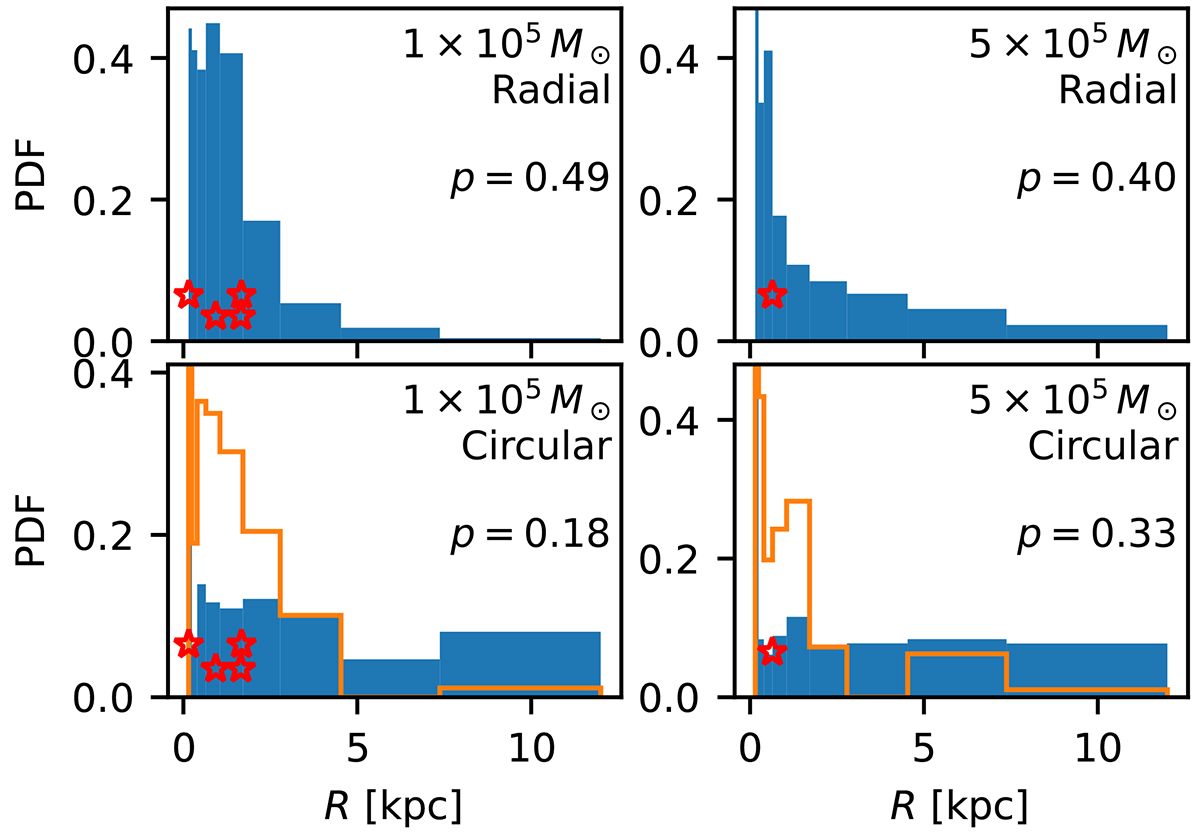
Comparison of the simulated and observed distributions of the projected distances of the GCs of Fornax. The blue histograms are constructed from all the simulated GCs. In orange histograms, we excluded the circular trajectories with initial radii over 3 kpc, to take into account the theoretical considerations from Sect. 2.4. The red stars mark the projected distances of the observed GCs. Indicated are the p-values of the KS test of the null hypothesis that the simulated and observed distributions are the same. For the circular orbits, the p-values are calculated for the restricted initial radius. A value below 0.05 means inconsistency.
Current usage metrics show cumulative count of Article Views (full-text article views including HTML views, PDF and ePub downloads, according to the available data) and Abstracts Views on Vision4Press platform.
Data correspond to usage on the plateform after 2015. The current usage metrics is available 48-96 hours after online publication and is updated daily on week days.
Initial download of the metrics may take a while.