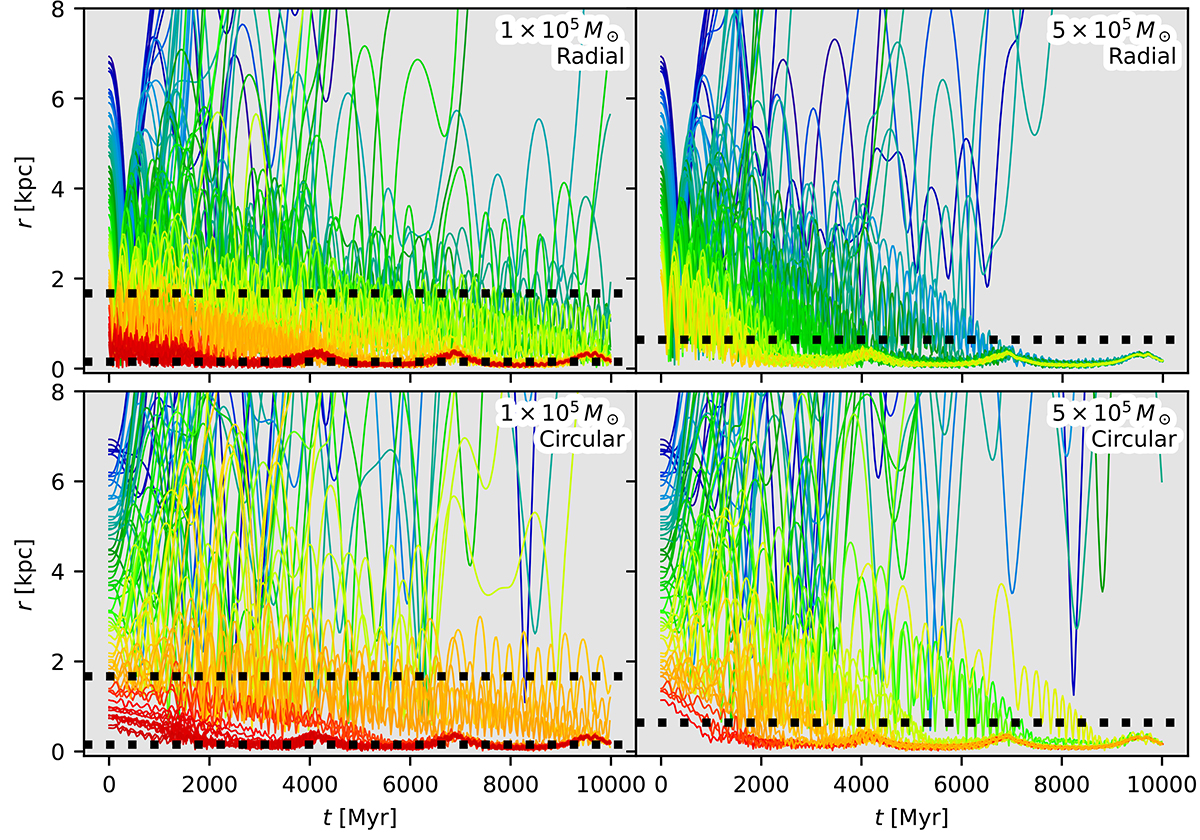
Fig. 4.
Download original image
Orbital decay of the GCs of Fornax, depending on their mass and initial trajectory. The vertical axis denotes the distance between the GG and the center of Fornax. For the light GCs, the two dotted horizontal lines indicate the range of the projected distances of the four lightest GCs of the real Fornax. For the massive GC, the horizontal dotted line indicates the projected distance of the most massive GC of the real Fornax.
Current usage metrics show cumulative count of Article Views (full-text article views including HTML views, PDF and ePub downloads, according to the available data) and Abstracts Views on Vision4Press platform.
Data correspond to usage on the plateform after 2015. The current usage metrics is available 48-96 hours after online publication and is updated daily on week days.
Initial download of the metrics may take a while.