Fig. 3.
Download original image
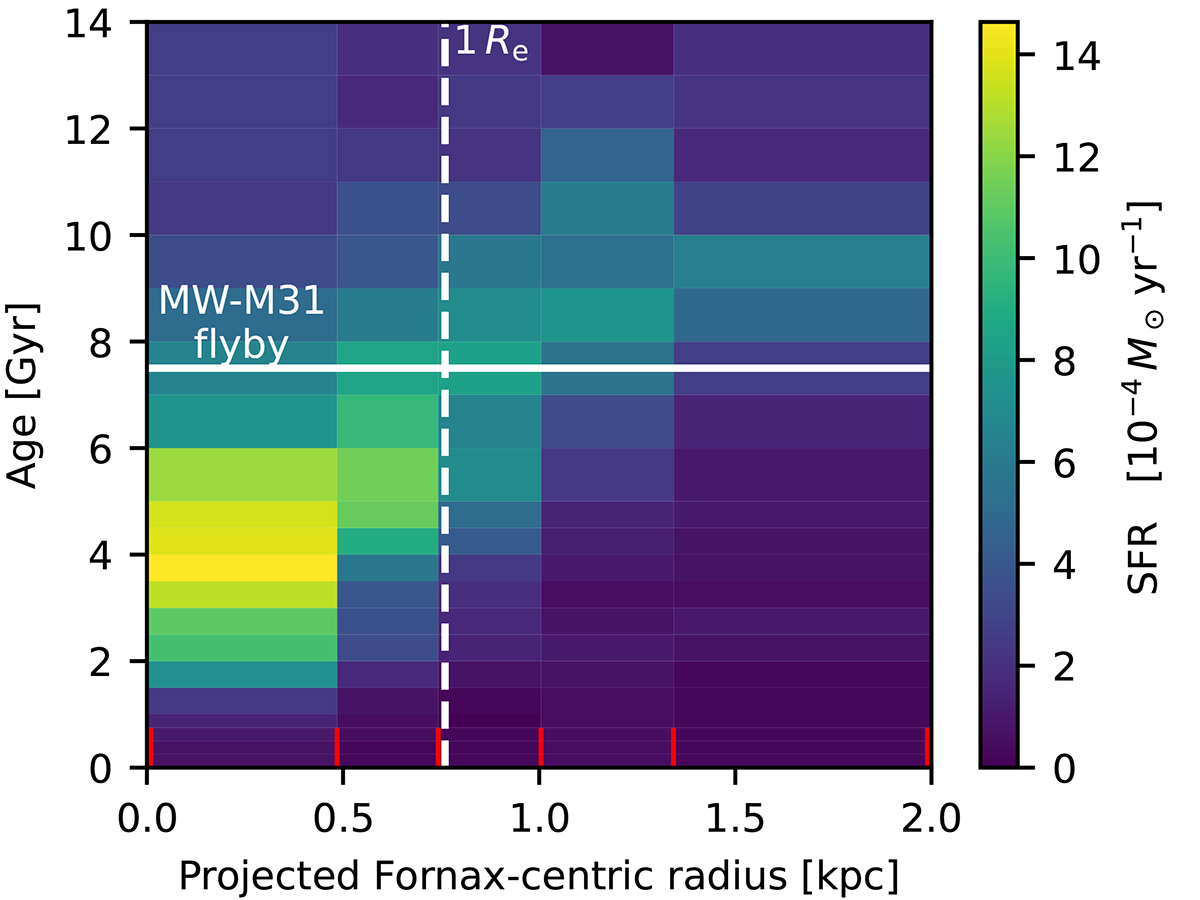
Spatially resolved star formation history of Fornax. The data come from de Boer et al. (2012). The color indicates the star formation rate in the given radial and age bin. Each radial bin contains an almost equal number of stars. The edges of the radial bins are marked by the short red lines. The vertical dotted line marks the effective radius of the galaxy, the horizontal full line the assumed time of the MW-M 31 flyby (Banik et al. 2018), when the material of Fornax left the MW in our scenario.
Current usage metrics show cumulative count of Article Views (full-text article views including HTML views, PDF and ePub downloads, according to the available data) and Abstracts Views on Vision4Press platform.
Data correspond to usage on the plateform after 2015. The current usage metrics is available 48-96 hours after online publication and is updated daily on week days.
Initial download of the metrics may take a while.