Open Access
Fig. 3.
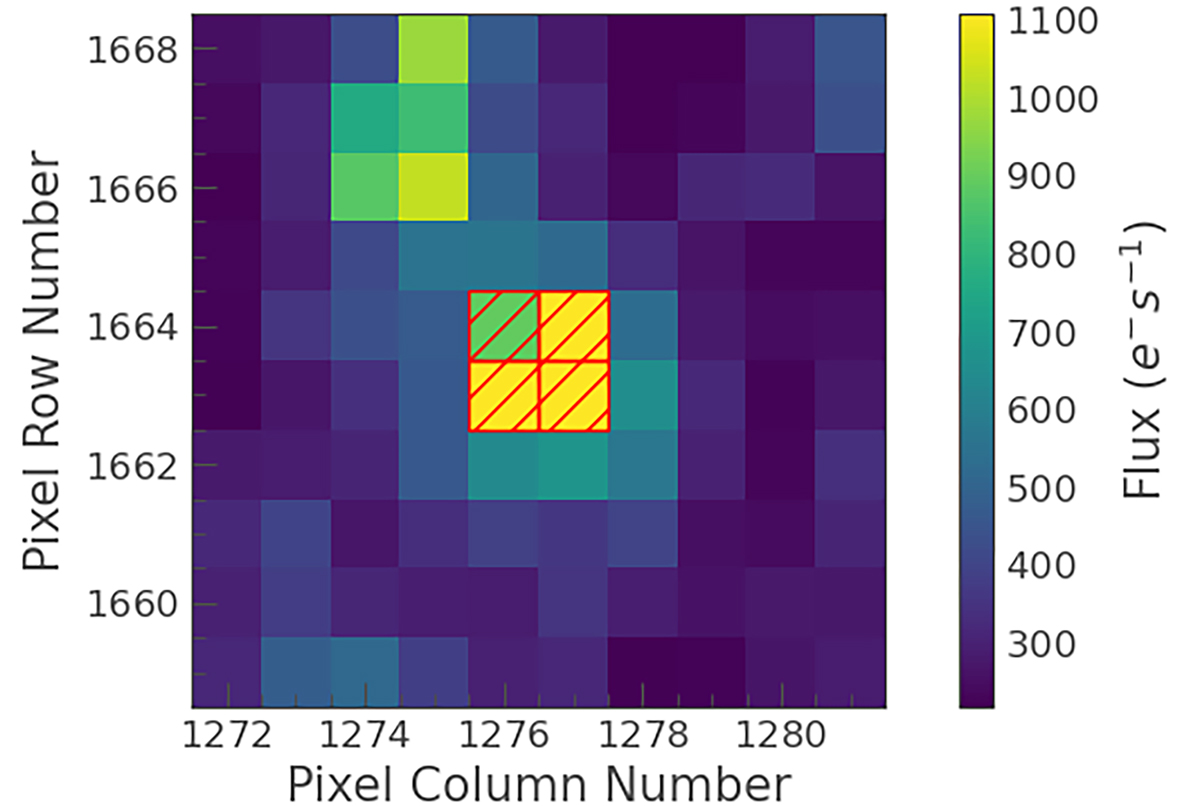
Download original image
TESS full-frame images from sector 39 for region around Gaia DR3 5822540653269409408. The LS periodogram was created for each pixel in the figure, and the periodic signal only detected pixels around the target (indicated by red square) is considered as a possible signal from the target.
Current usage metrics show cumulative count of Article Views (full-text article views including HTML views, PDF and ePub downloads, according to the available data) and Abstracts Views on Vision4Press platform.
Data correspond to usage on the plateform after 2015. The current usage metrics is available 48-96 hours after online publication and is updated daily on week days.
Initial download of the metrics may take a while.