Fig. 4
Download original image
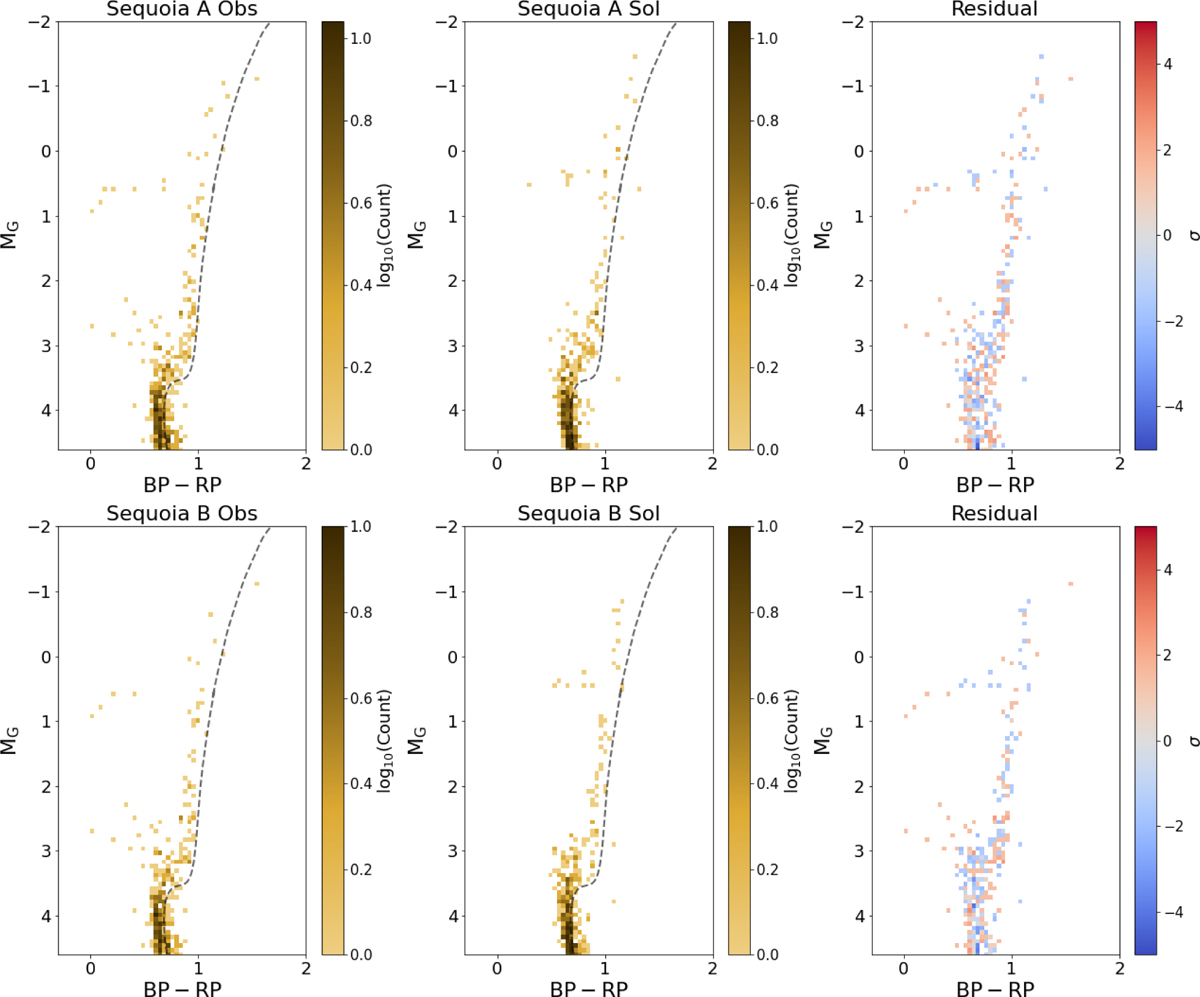
Absolute CMDs of the observed 5D Sequoia samples (first column). The top row shows Sequoia A and the bottom row shows the stricter selection Sequoia B. The middle column shows the best fit solution CMD and the final column shows the residual in terms of σ. The black dashed line in the first two columns corresponds to an isochrone (BaSTI-IAC alpha-enhanced with an age of 11.6 Gyr and [Fe/H] of −0.8 dex) that separates the blue and red halo sequences.
Current usage metrics show cumulative count of Article Views (full-text article views including HTML views, PDF and ePub downloads, according to the available data) and Abstracts Views on Vision4Press platform.
Data correspond to usage on the plateform after 2015. The current usage metrics is available 48-96 hours after online publication and is updated daily on week days.
Initial download of the metrics may take a while.