Open Access
Fig. 8.
Download original image
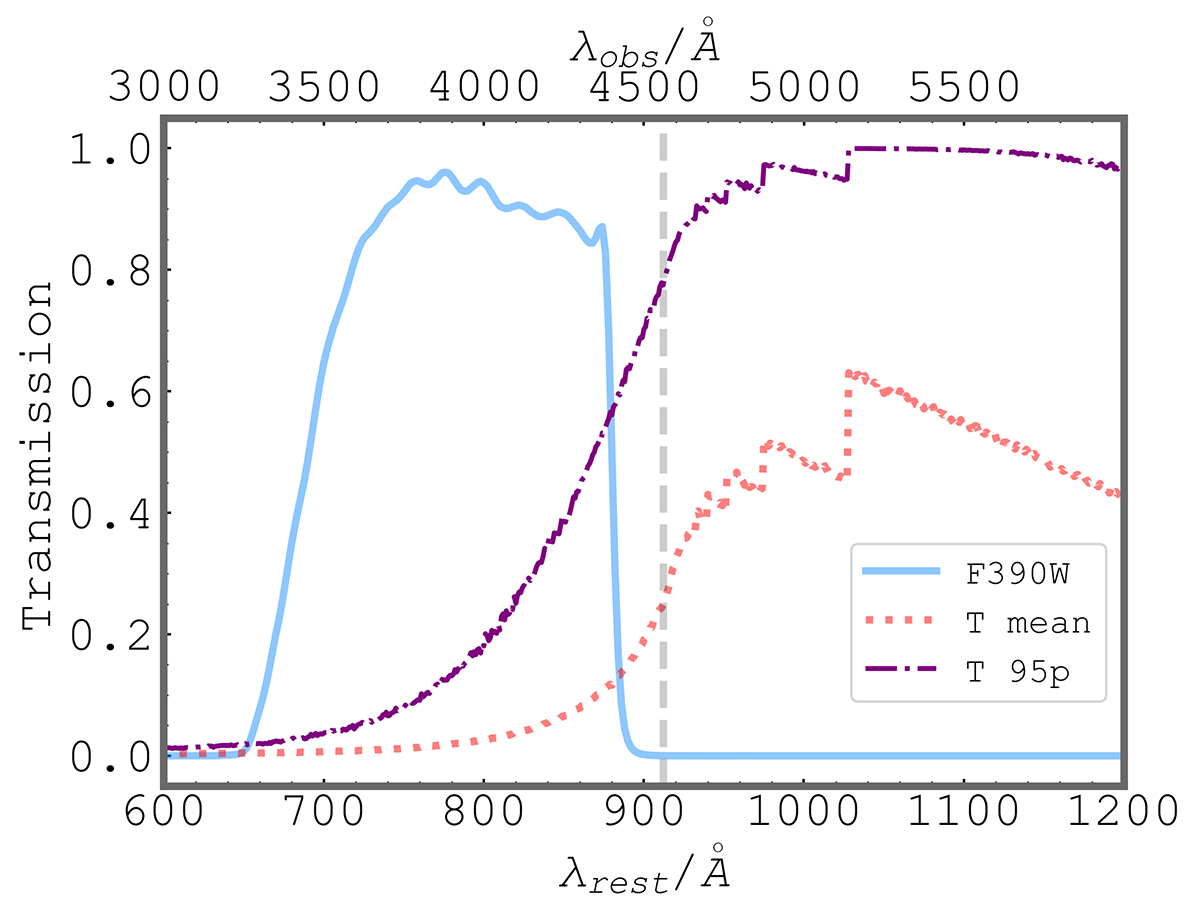
Mean IGM transmission as a function of wavelength over 10 000 lines of sight is shown as a red dotted line. The purple dash dotted line is 95 percentile IGM transmission and the blue solid line represents the F390W filter curve. A vertical gray dashed line marks the beginning of LyC region at 912 Å.
Current usage metrics show cumulative count of Article Views (full-text article views including HTML views, PDF and ePub downloads, according to the available data) and Abstracts Views on Vision4Press platform.
Data correspond to usage on the plateform after 2015. The current usage metrics is available 48-96 hours after online publication and is updated daily on week days.
Initial download of the metrics may take a while.