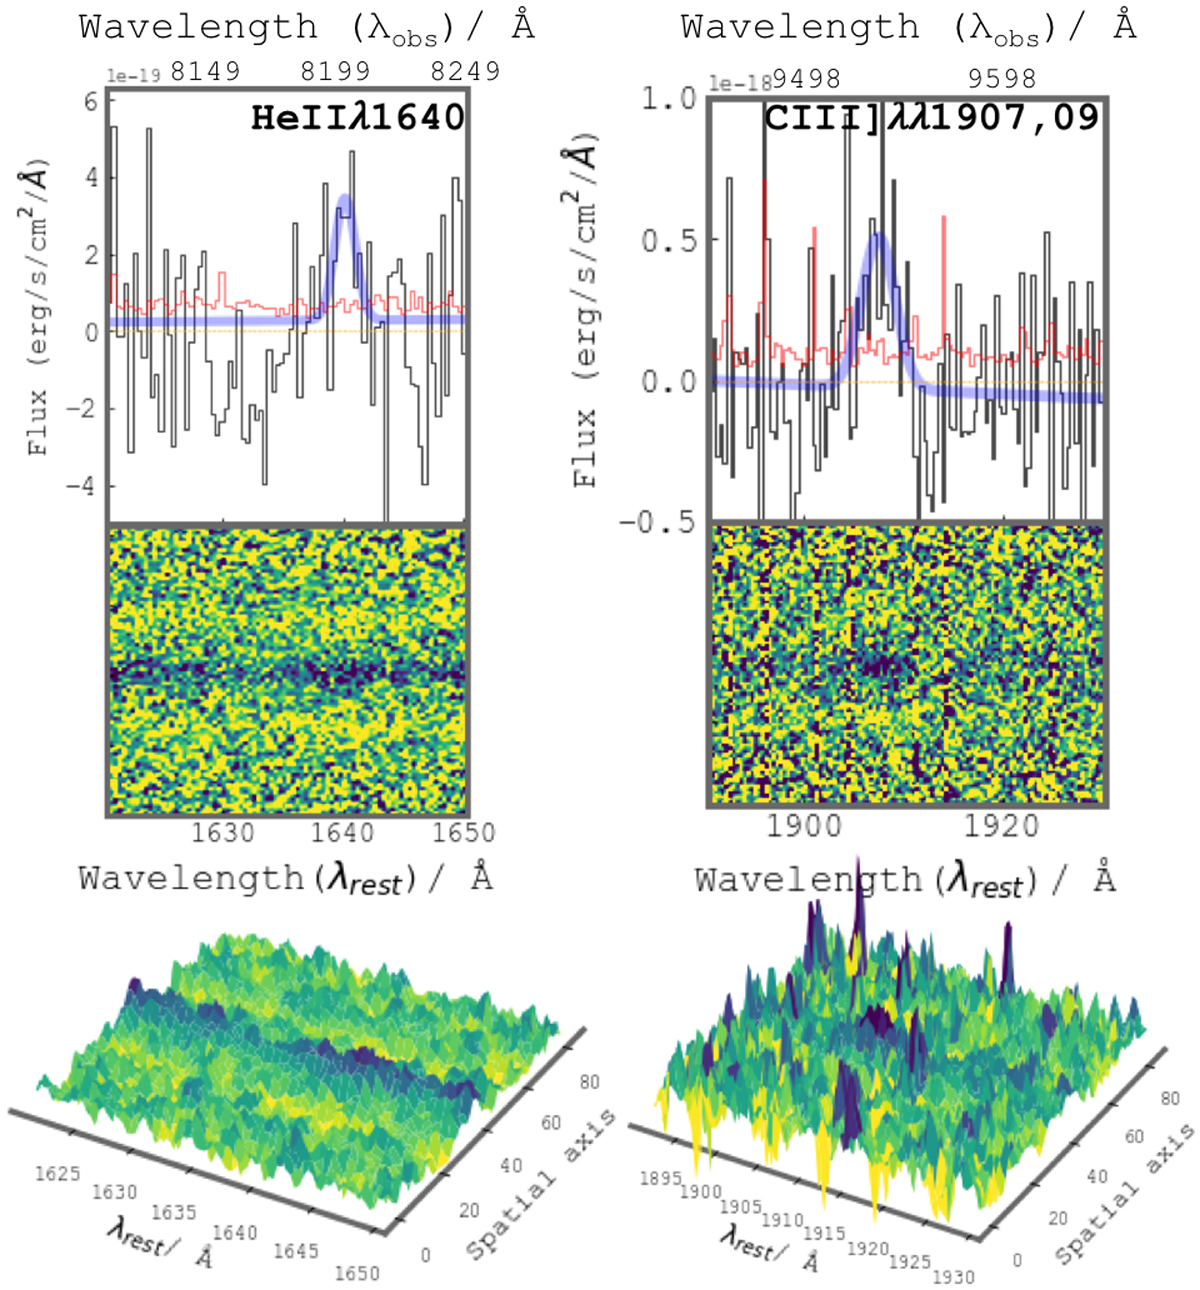
Fig. 5.
Download original image
Zoom-ins show two emission features detected in the VIS arm of the X-Shooter spectra. The left and right panels consist of the 1D continuum subtracted (upper), 2D (middle), and 3D (bottom) spectrograms of HeIIλ1640 with characteristic P-Cygni line profile and semi-forbidden non-resolved CIII]λλ1907,1909 line. The fitted Gaussian emission line is overplotted in blue. The 1D spectra in both panels is shown in black, error spectrum in red, and zero-level flux with the orange line. Sharp peaks notable in 1D around the CIII]λλ1907,1909 line belonging to the sky residuals are also visible in 2D and 3D spectrograms. The 1D and 2D spectrograms are displayed in rest and observed wavelength frame.
Current usage metrics show cumulative count of Article Views (full-text article views including HTML views, PDF and ePub downloads, according to the available data) and Abstracts Views on Vision4Press platform.
Data correspond to usage on the plateform after 2015. The current usage metrics is available 48-96 hours after online publication and is updated daily on week days.
Initial download of the metrics may take a while.