Fig. 4.
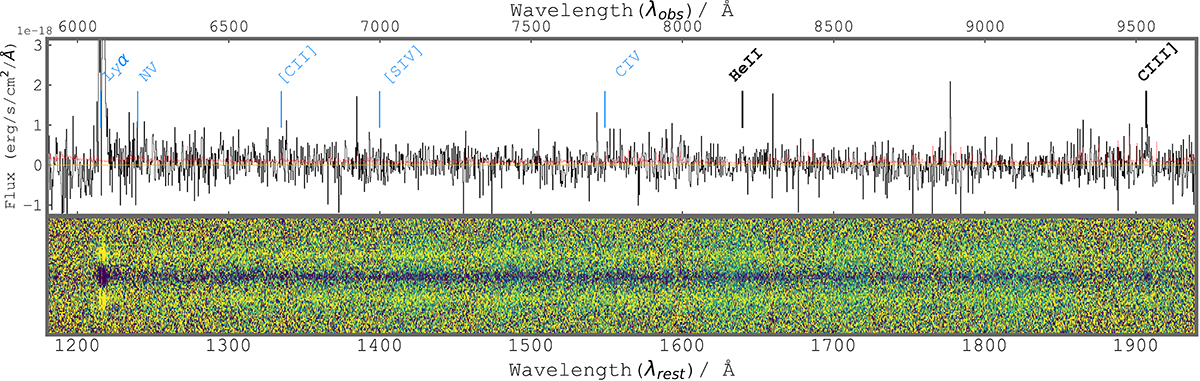
Download original image
X-Shooter VIS-arm 1D spectra (upper panel) and 2D spectra (bottom panel) covering the rest-UV wavelengths from ∼1180 Å–1940 Å. The spectrum (black) is binned by a factor of 9 to increase the S/N of the continuum and other spectroscopic features, while 1σ uncertainty is presented in red color and orange line shows 0 flux level. The displayed 1D spectrum is continuum subtracted. The location of the reported and analyzed emission features (HeIIλ1640 and CIII]λλ1907,1909) are marked with thick black markers, while the positions of the other lines reported in Vanzella et al. (2018) from FORS spectroscopy (Lyα, NVλ1240, [CII]λ1335.71, [SIV]λλ1393,1402, CIVλλ1548,1550) are marked with thin blue markers.
Current usage metrics show cumulative count of Article Views (full-text article views including HTML views, PDF and ePub downloads, according to the available data) and Abstracts Views on Vision4Press platform.
Data correspond to usage on the plateform after 2015. The current usage metrics is available 48-96 hours after online publication and is updated daily on week days.
Initial download of the metrics may take a while.