Fig. 12.
Download original image
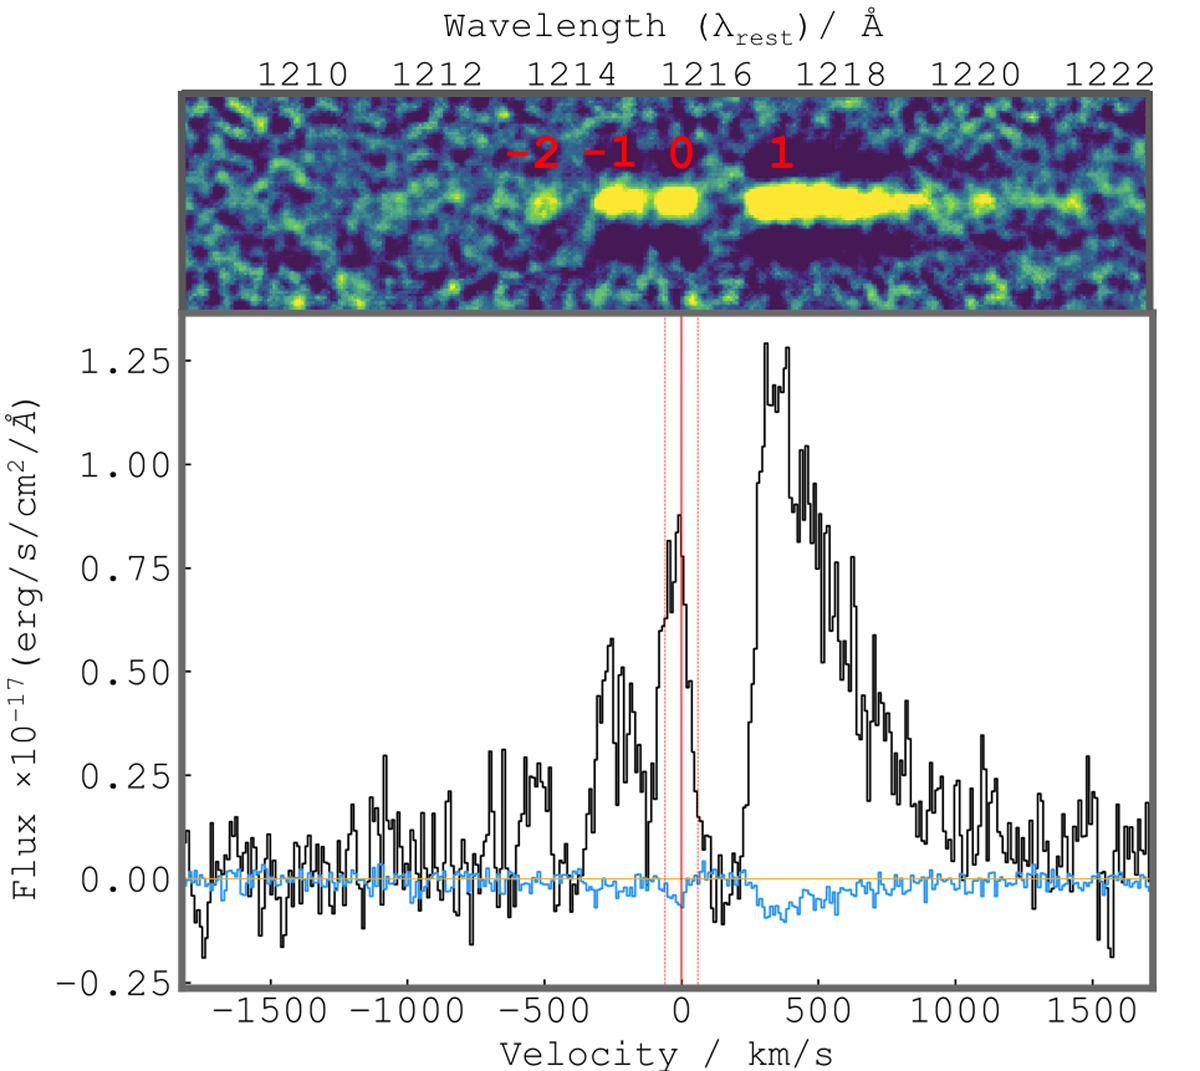
2D and the 1D spectra of the Lyα extracted from X-Shooter shown in the top and bottom panels. The blue line shows the spectrum of the sky, while the red vertical line (on the 1D spectrum) marks the systemic velocity of the source with the one sigma error (dotted vertical lines), located at +35 km s−1 form the central Lyα peak dubbed 0. The other Lyα peaks are marked as −2, −1 (blueward the systemic velocity), and 1 (redward from systemic velocity).
Current usage metrics show cumulative count of Article Views (full-text article views including HTML views, PDF and ePub downloads, according to the available data) and Abstracts Views on Vision4Press platform.
Data correspond to usage on the plateform after 2015. The current usage metrics is available 48-96 hours after online publication and is updated daily on week days.
Initial download of the metrics may take a while.