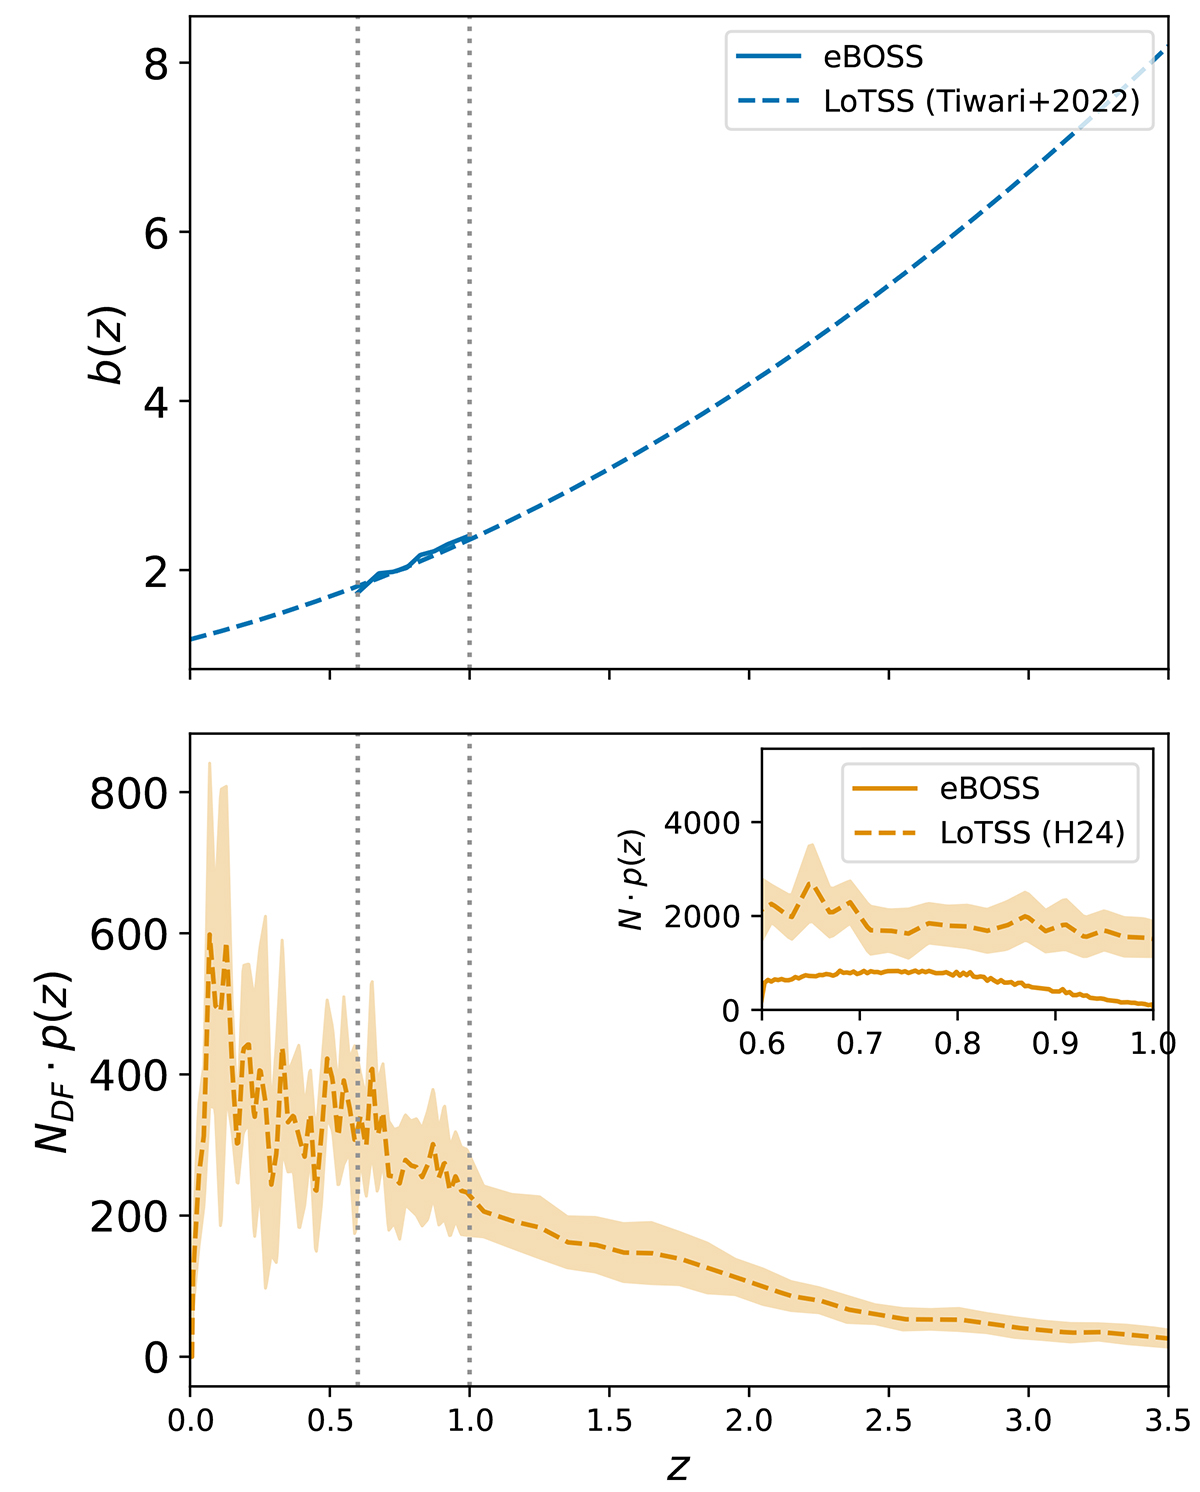
Fig. 3.
Download original image
Upper panel: Model prediction of the bias function b(z) for eBOSS and LoTSS DR2 surveys. The vertical dotted lines show the redshift range of eBOSS LRGs. Lower panel: Redshift distribution of LoTSS radio sources as inferred from the exquisite multi-wavelength coverage of LoTSS Deep Fields (see Duncan et al. 2021; Hale et al. 2024; Bhardwaj et al. 2024 for details). NDF represents the total number of galaxies in LOFAR Deep Fields and p(z) is the normalised redshift distribution. The inset shows the redshift distribution Np(z) for eBOSS and wide field LoTSS DR2 surveys, where the N denotes the total number of galaxies in each survey, respectively. The histogram redshift interval is 0.0035. The b(z) and p(z) shown here are used as inputs to generate the mock catalogue.
Current usage metrics show cumulative count of Article Views (full-text article views including HTML views, PDF and ePub downloads, according to the available data) and Abstracts Views on Vision4Press platform.
Data correspond to usage on the plateform after 2015. The current usage metrics is available 48-96 hours after online publication and is updated daily on week days.
Initial download of the metrics may take a while.