Fig. 2.
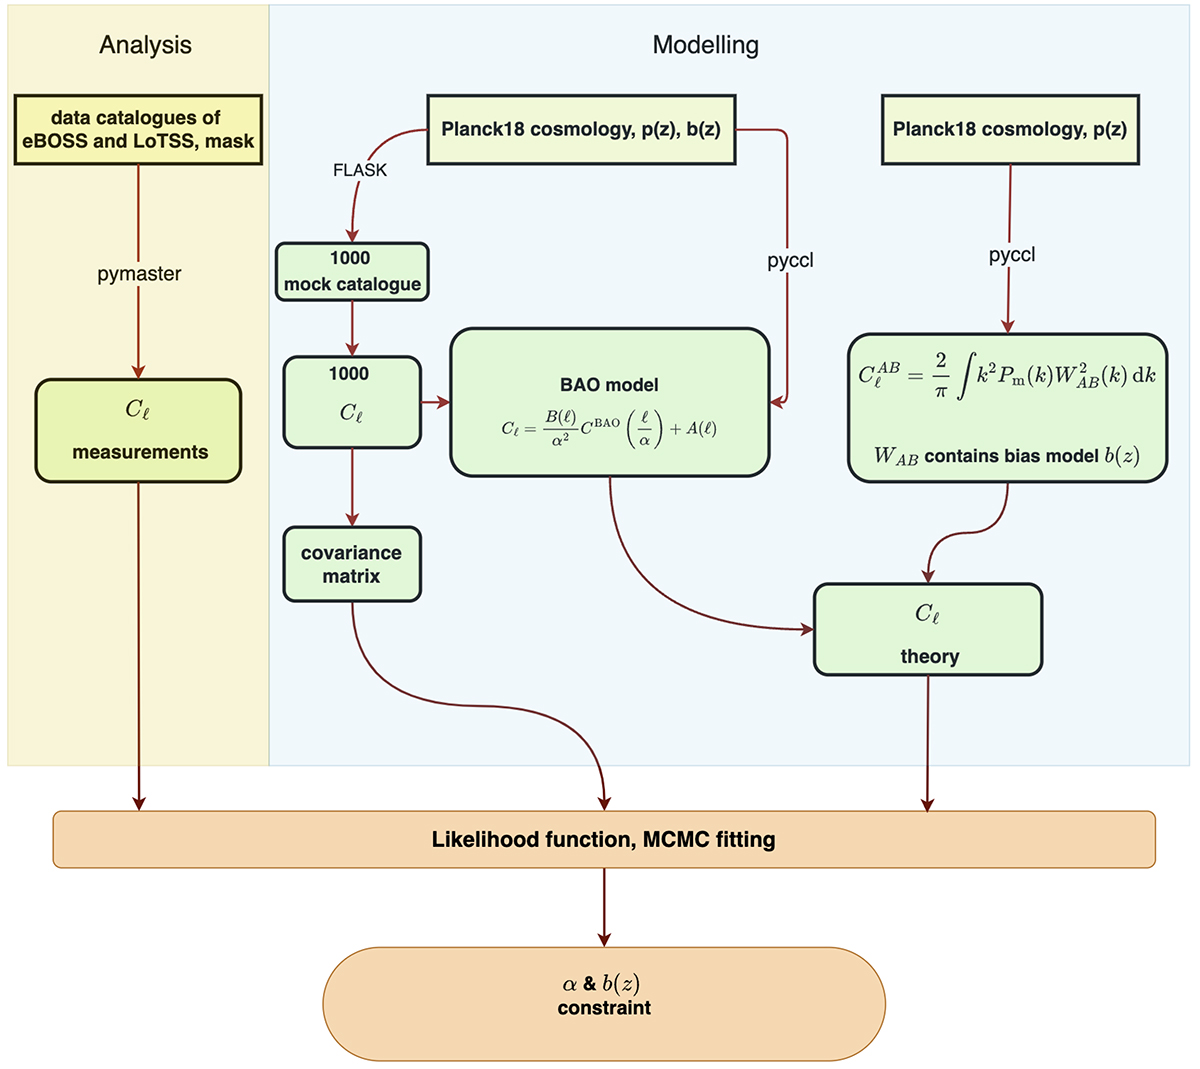
Download original image
Flowchart of this work. Left panel: Analysis (in light yellow region), representing the process of using real survey data to measure the angular power spectrum. Right panel: Modelling (in light blue region), which consists of generating mock catalogues and computing the theoretical angular power spectrum. The measured Cℓ, the theoretical prediction, and the covariance matrix (computed from 1000 mock catalogues) are then used to construct the final likelihood. The likelihood is subsequently used for Markov chain Monte Carlo (MCMC) parameter estimation. Note: the theoretical templates differ depending on whether the constraints are on the BAO parameters or the bias parameters.
Current usage metrics show cumulative count of Article Views (full-text article views including HTML views, PDF and ePub downloads, according to the available data) and Abstracts Views on Vision4Press platform.
Data correspond to usage on the plateform after 2015. The current usage metrics is available 48-96 hours after online publication and is updated daily on week days.
Initial download of the metrics may take a while.