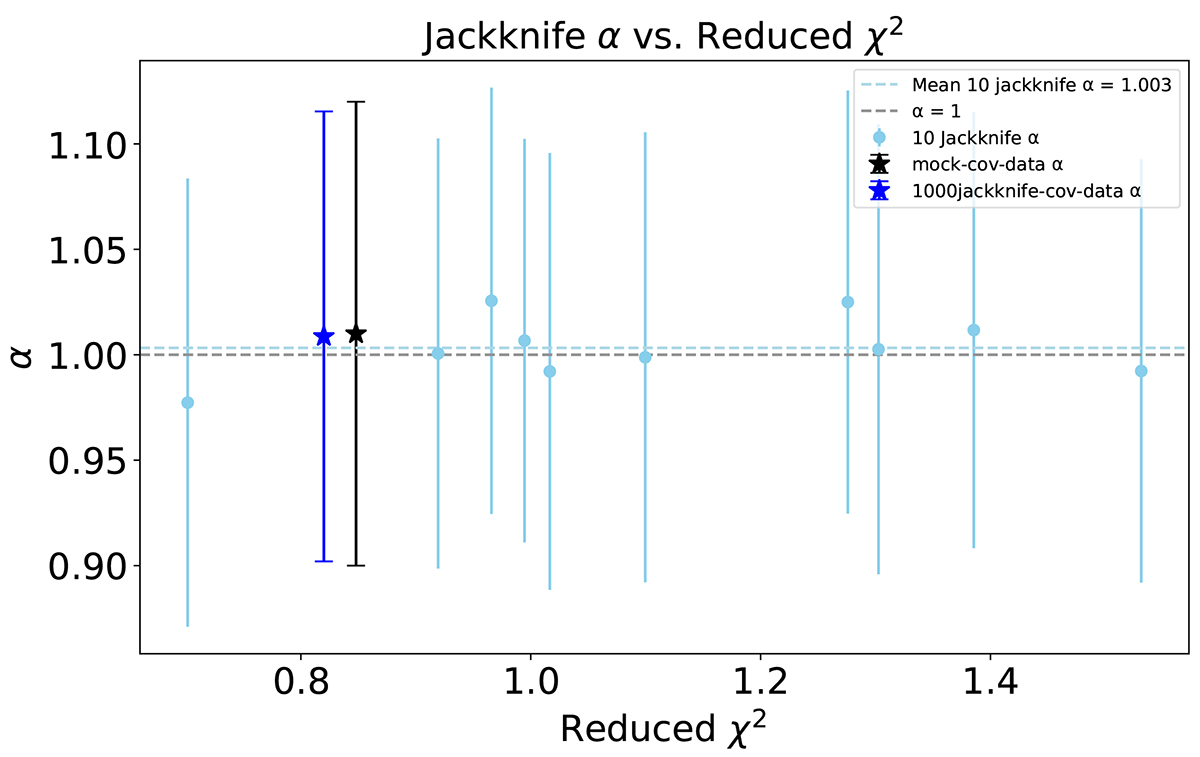
Fig. B.2.
Download original image
Jackknife robustness test performed by dividing the eBOSS and LoTSS masks into ten subregions and computing the eBOSS × LoTSS angular power spectrum for the first redshift bin, 0.6 < z < 0.66, using a leave-one-out approach. It illustrates the 10 α measurements along with their associated 68% confidence interval as a function of their reduced χ2 values (light blue points). The black pentagon represents the α measurement obtained from the real data measurement using covariance generated from FLASK mock, corresponding to Case 1 in Table 1. The blue pentagon represents the result using 1000-subregion jackknife covariance with real data measurement.
Current usage metrics show cumulative count of Article Views (full-text article views including HTML views, PDF and ePub downloads, according to the available data) and Abstracts Views on Vision4Press platform.
Data correspond to usage on the plateform after 2015. The current usage metrics is available 48-96 hours after online publication and is updated daily on week days.
Initial download of the metrics may take a while.