Fig. 13.
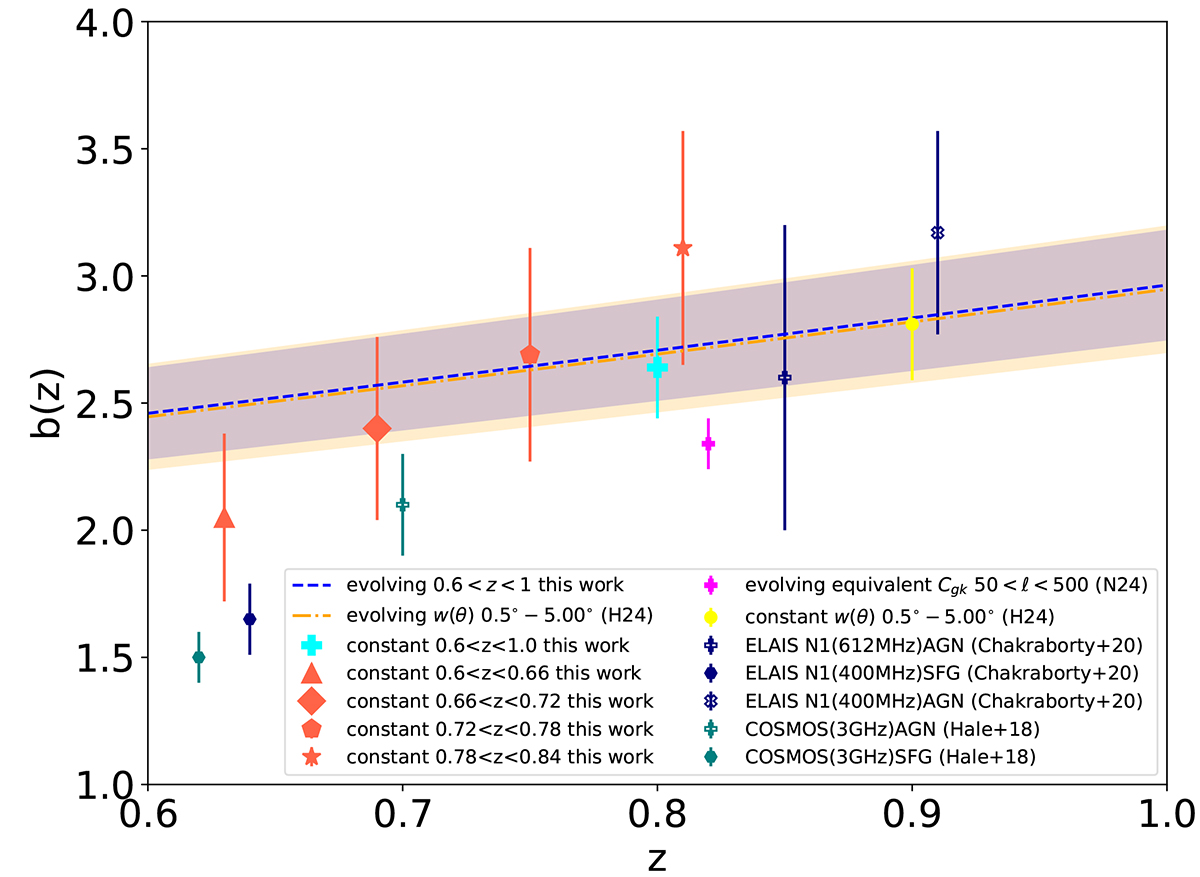
Download original image
Bias values measured in this work and compared with previous studies. The evolving bias model derived from this work (0.6 < z < 1) is shown as a dashed blue line with a shaded error band, while the evolving bias model from H24 is shown as a dot-dashed orange line with a shaded band. The constant bias over the full redshift range (0.6 < z < 1) from this work is shown as a cyan pentagon. Constant biases in four redshift bins from this work are shown as Tomato-colored markers with different shapes. Additional comparisons include the evolving bias derived from LoTSS × CMB lensing cross-correlation (N24), plotted as magenta diamonds; the constant bias from H24 is shown as a yellow circle. The AGN and SFG biases from Hale et al. (2018) and Chakraborty et al. (2020) are plotted as hollow markers with navy and teal edges, respectively, reflecting their frequency bands and galaxy types. All error bars represent 1σ uncertainties.
Current usage metrics show cumulative count of Article Views (full-text article views including HTML views, PDF and ePub downloads, according to the available data) and Abstracts Views on Vision4Press platform.
Data correspond to usage on the plateform after 2015. The current usage metrics is available 48-96 hours after online publication and is updated daily on week days.
Initial download of the metrics may take a while.