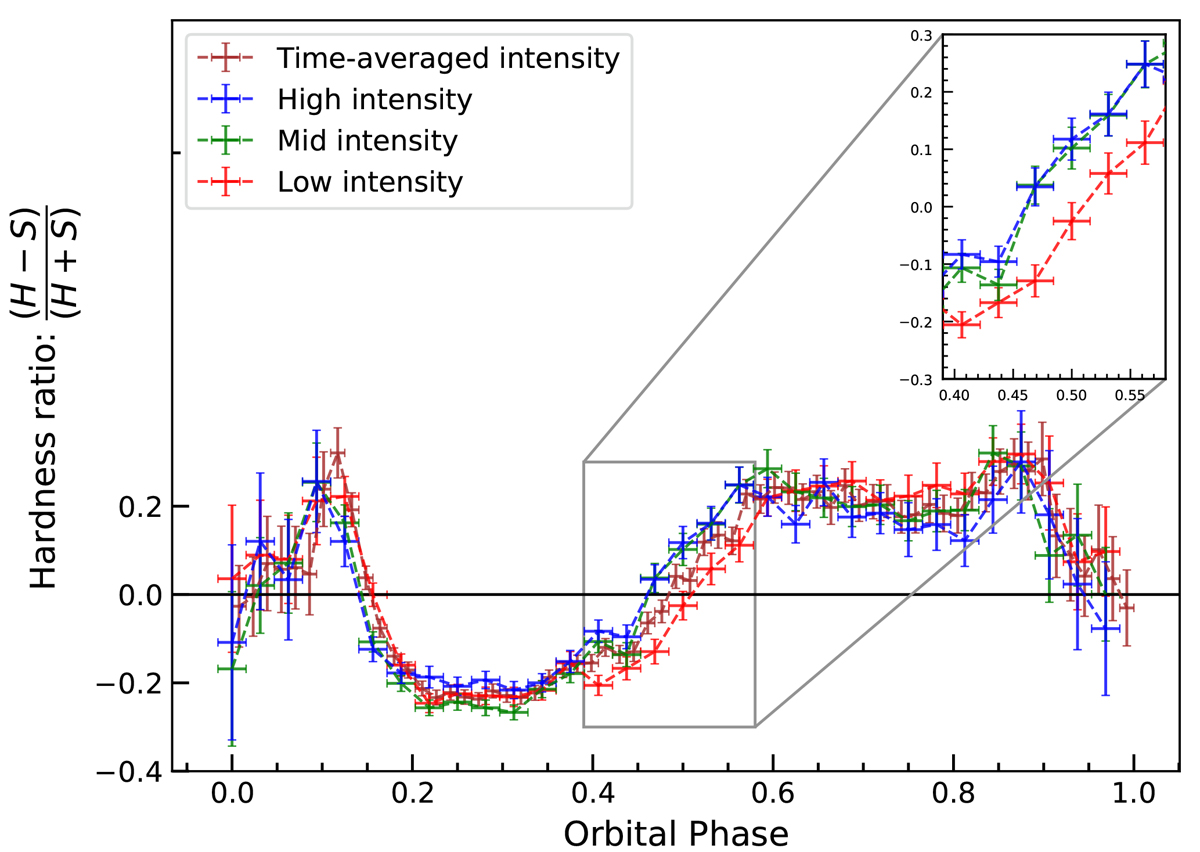
Fig. 5.
Download original image
Hardness ratio plots between the soft (S; 2.0−4.0 keV) and hard (H; 12.0−20.0 keV) energy bands for the low (red), mid (green), and high (blue) intensity levels. The inset in the upper right corner shows that the hardness ratio in the low-intensity level rises slowly compared to the high-intensity level in the phase range 0.4−0.6.
Current usage metrics show cumulative count of Article Views (full-text article views including HTML views, PDF and ePub downloads, according to the available data) and Abstracts Views on Vision4Press platform.
Data correspond to usage on the plateform after 2015. The current usage metrics is available 48-96 hours after online publication and is updated daily on week days.
Initial download of the metrics may take a while.